Maretron® N2KView®
Vessel Monitoring and Control Software for NMEA 2000® Networks
User’s Manual
Revision 6.3.0
Copyright © 2021 Carling Technologies, Inc.
60 Johnson Ave.
Plainville, CT 06062 USA
All Rights Reserved
Maretron Manual Part #: M001401
Revision History
|
Rev. |
Description |
|
1.0 |
Original document. |
|
2.2 |
New release corresponding to Version 2.2 of N2Kview |
|
2.3 |
New release corresponding to Version 2.3 of N2Kview |
|
2.4 |
New release corresponding to Version 2.4 of N2KView |
|
2.5 |
New release corresponding to Version 2.5 of N2Kview |
|
2.6 |
New release corresponding to Version 2.6 of N2Kview |
|
3.0 |
New release corresponding to Version 3.0 of N2Kview |
|
3.2 |
New release corresponding to Version 3.2 of N2Kview |
|
3.4 |
New release corresponding to Version 3.4 of N2Kview |
|
3.5 |
New release corresponding to Version 3.5 of N2Kview |
|
3.6 |
New release corresponding to Version 3.6 of N2Kview |
|
3.6.1 |
Update for version 3.6.1 of N2KView |
|
3.6.2 |
Update for version 3.6.2 of N2KView |
|
3.6.3 |
Update for version 3.6.3 of N2KView |
|
4.0.0 |
Update for version 4.0.0 of N2KView |
|
5.0.0 |
Update for version 5.0.0 of N2KView |
|
5.0.6 |
Update for version 5.0.6 of N2KView |
|
5.0.15 |
Update for version 5.0.15 of N2KView |
|
5.1.0 |
Update for version 5.1.0 of N2KView |
|
6.0.0 |
Update for version 6.0.0 of N2KView |
|
6.0.12 |
Update for version 6.0.12 of N2KView |
|
6.0.14 |
Update for version 6.0.14 of N2KView |
|
6.3.0 |
Update for version 6.3.0 of N2KView |
Table of Contents
6.1 Install IPG100 or USB100 if applicable
6.2 Get the N2KView Install Program
6.3.1 Accept the License Agreement
6.3.3 Continue with the Installation
8.1 Data Security and Encryption
8.2 Using Maretron’s Cloud Server
9.1.5 Favorite Screens and Parameter Display
9.1.6 Protecting the System Configuration
9.3.1 Changing Between User-Defined screens
9.3.3 Switching Between Day and Night Mode
9.3.4 Switching Between Windowed and Full-Screen Configurations
9.4 Commands & Settings Dialog
9.4.8 Power Management Sub-Menu
9.5.2 Active Button Gray (4x1)
9.5.4 Active Button Gray (2x1)
9.5.5 Active Button Invisible (1x1)
9.5.6 Air Conditioning / Heating
9.5.10 Bar Graph Vertical (1x2)
9.5.12 Circuit Breaker / Rocker Switch (2x1)
9.5.13 Rocker Switch Left/Right (6x1)
9.5.19 Digital Invisible (2x1)
9.5.33 Line Graph / Depth Graph / Indicator Graph
9.6.5 Air Conditioning / Heating
9.6.7 BNWAS (Bridge Navigation Watch Alarm System)
9.6.11 Electrical Distribution
9.6.23 NMEA 2000 – N2KView Connection
9.6.36 Transmission (Twin Disk)
10.2.4 Vessel Alert Operating Modes
10.2.6 Available Alert Classes
10.3.4 Alert Log for all Alerts
10.4.8 Alerts for each Parameter
10.4.17 Electrical Distribution
10.4.28 NMEA 2000 – N2KView Connection
10.4.39 Transmission (Twin Disk)
11 BNWAS (Bridge Navigation Watch Alarm System
11.1.1 Enabled / Disabled / Automatic Control
11.1.3 Visual Indication Stage
11.1.4 First Stage Bridge Audible Alarm
11.1.5 Second Stage Remote Audible Alarm
11.1.6 Third Stage Remote Audible Alarm
11.1.7 Optional Reset Switch Instance
11.1.8 Optional Reset Switch Channel
11.1.9 BNWAS will Reset when the Switch is
13.1 Glossary of Terms used in Anchoring
13.2 How is N2KView going to help you anchor
13.3 Configuring N2KView Anchoring.
13.7 Dragging you anchor while Setting
15 Send data to the Telemetric Cloud Service
15.1.1 Maretron Real Time Cloud Service
15.1.2 Maretron Telemetric Cloud Service
15.2 Telemetric Cloud Service Dialog
15.2.2 Selecting Parameters to be Transmitted
15.2.4 Maximum amount of data that can be transmitted
15.3 Telemetric Cloud Service Parameter Editor
15.3.7 Also Transmit on Change
16.2 Building the N2KView Mobile Screens
16.2.1 Other Configuration Data
16.3 Send the Configuration to the IPG100
16.4 Starting N2KView® on the iPhone
16.5.3 Cloud Connection Method
16.6 Download the Configuration File
19 Maretron Software License Agreement
20 Example of Setting up the AXIS Quad Video Server 241Q
20.1 Install the AXIS Camera Manager
Table of Figures
Figure 1 – N2KView Installation License Agreement Page
Figure 2 – Additional N2KView Installation Tasks.
Figure 3 – Maretron N2KView Installation Wizard Completion Page
Figure 4 – N2KView Startup Disclaimer Screen
Figure 5 – N2KView Window with Tabs Displayed
Figure 6 – NMEA 2000® Connection Dialog
Figure 7 – Setting Instance Number
Figure 8 – N2KView Opening Dialog
Figure 9 – Typical N2KView Screen
Figure 10 – N2KView Commands & Settings Dialog.
Figure 12 – Clean Screen Dialog
Figure 13 – Configuration Sub-Menu
Figure 14 – General Configuration Dialog
Figure 15 – Load Configuration dialog
Figure 16 –TSM/MBB Load Configuration Dialog
Figure 17 – Save Configuration Dialog
Figure 18 – TSM/MBB Save Configuration Dialog
Figure 20 – Connections Settings Dialog
Figure 21 – Breaker Lockout Dialog
Figure 22 – Screens Setup Screen
Figure 24 – Selected Component in Screens Setup Mode
Figure 26 – Example of setting Divisions and Ranges
Figure 27 – Set Password Dialog
Figure 28 – Units Setup Dialog
Figure 29 – Active Button (4x1) Example
Figure 30 – Active Button Gray (4x1) Component Example
Figure 31 – Active Button (2x1) ComponentExample
Figure 32 – Active Button Gray (1x1) Component Example
Figure 33 – Active Button Invisible (1x1) Component Example
Figure 34 – Air Conditioner Component Example
Figure 35 – Q-Logic Air Conditioner Component with Aux Heat
Figure 36 – Analog Clock Component Example
Figure 38 – Attitude Indicator Example
Figure 39 – Bar Graph Component Example
Figure 40 – Bar Graph Example with Min Max Marks
Figure 41 – Borderless Bar Component Example
Figure 42 – Rocker Switch Component Examples
Figure 44 – GFCI Tripped Breaker
Figure 45 – Breaker with Local Override
Figure 46 – Breaker under Timer Control
Figure 47 – Locked Rocker Switch
Figure 49 – Group Controlled Rocker Switch
Figure 50 – Alert Controlled Rocker Switch
Figure 51 – Load Controlled Rocker Switch
Figure 52 – Rocker Switch (6x1) Component Example.
Figure 53 – Vertical Switch Component Examples
Figure 54 – Digital Component Examples
Figure 55 – Digital (4x3) Component Example
Figure 56 – Digital (3x2) Component Example
Figure 57 – Digital (2x1) Component Example
Figure 58 – Digital Invisible (2x1) Component Example
Figure 59 – All Digital Components
Figure 60 – Digital Counter Component Example
Figure 61 – Dimmer (2 Button) Component Example
Figure 62 – Dimmer (3 Button) Component Example
Figure 63 – Ice Maker Component Example
Figure 64 – Gauge Component Example
Figure 65 – Gauge with Min Max Markers
Figure 66 – Gauge (5x6) Component Example
Figure 67 – GPS Status Component Example
Figure 68 – Head Up Rose Component Example
Figure 69 – Inclinometer Component Example
Figure 70 – Inclinometer with Min Max Marks
Figure 71 – Indicator (4x1) Component Example
Figure 72 – Indicator (2x1) Component Example
Figure 73 – Indicator (1x1) Component Example
Figure 74 – Indicator Beam Examples
Figure 75 – User Defined Screen with Indicator Beams
Figure 76 – Line Graph Component Example
Figure 77 – Depth Graph Component Example
Figure 78 – Indicator Graph Example
Figure 79 – Moon Phase Component Example
Figure 80 – North Up Rose Component Example
Figure 81 – North Up Rose with History Markers
Figure 82 – Backlit Pushbutton (1x1) Component Examples
Figure 83 – Backlit Pushbutton (2x1) Component Examples
Figure 84 – Metallic Pushbutton (1x1) Component Examples
Figure 85 – Metallic Pushbutton (2x1) Component Examples
Figure 86 – Pushbutton (4x1) Component Examples
Figure 87 – Invisible Push Button (1x1) Component Example
Figure 88 – Rate of Turn Component Example
Figure 89 – Rudder Angle Component Example
Figure 90 – Rudder Angle with Min Max Marks
Figure 91 – Example Screen with Screen Status Components
Figure 92 – Signal Strength Component Example
Figure 93 – Status Bar (28x1) Component Examples
Figure 94 – Status Bar (12x1) Component Examples
Figure 95 – Status Bar (8x1) Component Examples
Figure 96 – Tank Component Example
Figure 97 – Tank Component Example with Min Max Marks
Figure 98 – Text Component Example
Figure 99 – Multi-line Text Component Example
Figure 100 – Text Message (SMS) Component Example
Figure 101 –Timer Component Example
Figure 102 – Wind Angle Component Example
Figure 103 – Wind Angle Component with Min Max Marks
Figure 104 – Wind Close Angle Component Example
Figure 105 – Close Angle Component with Min Max Marks
Figure 106 – Video Component Examples
Figure 107 – 3:4 Video (No Border)Component Examples
Figure 108 – 4:3 Video (No Border) Component Examples
Figure 109 – 16:9 Video (No Border) Component Examples44
Figure 110 – Watermaker Component Example
Figure 111 – Watermaker with request for Confirmation
Figure 112 – Fuel Management Warning Screen
Figure 114 – Over Full Alert Status Bar
Figure 116 – Alert Status Screen
Figure 117 – Alert Detail Dialog
Figure 118 – Alert Table Editor
Figure 119 – Alert Table Editor
Figure 120 – Alert Editor Example
Figure 121 – Alert Editor – Definition Section
Figure 122 – Channel Drop Down List
Figure 123 – Instance Drop Down List
Figure 124 – High Alert Parameters
Figure 125 – Trigger Configuration – High Alert
Figure 126 – Low Alert Parameters
Figure 127 – Trigger Configuration – Low Alert
Figure 128 – Trigger Configuration – Data Unavailable Alert
Figure 129 – Trigger Configuration – On Alert
Figure 130 – Trigger Configuration – Off Alert
Figure 131 – Trigger Configuration – Entry On Alert
Figure 132 – Trigger Configuration Editor – Tripped Alert
Figure 133 –Configuration – Burnt Out Bulb Alert
Figure 134 – Trigger Configuration Editor – Server Disconnected Alert
Figure 135 – Outside Radius Alert Parameters
Figure 136 – Trigger Configuration – Outside Radius Alert
Figure 137 – Trigger Configuration – Anchor Watch Alert
Figure 138 – Trigger Configuration – Inside Radius Alert
Figure 139 – Trigger Configuration – GPS Quality Alert
Figure 140 – Direction Alert Parameters
Figure 141 – Trigger Configuration – Direction Alert
Figure 142 – Alert Editor – Time Alert
Figure 143 – Alert Editor– Annunciator Actions
Figure 144 – Annunciator Tone Selection
Figure 145 – Alert Actions Dialog – Email Actions Tab
Figure 146 – Alert Editor– SMS (Text) Actions Tab
Figure 147 – Alert Editor– Switch Actions Tab
Figure 148 – AC Load Shedding Dialog
Figure 149 – Load Shed Source Dialog
Figure 150 – Camera Setup Dialog
Figure 151 – Camera Type Drop Down List
Figure 152 – Camera Editor Example with Axis M3113 Camera
1 Introduction
Thank you for purchasing the Maretron N2KView Vessel Monitoring and Control System. N2KView® is a comprehensive vessel monitoring and control software that goes beyond simple monitoring. With N2KView® you get additional functionality including alerts, video, control, and fuel management. The alerts functionality allows you to setup as many warnings and alarms as you need so you can be forewarned of potential problems. With alerts, you can relax knowing that the system is watching for smoke, CO, high bilge water, or anything else you deem important. N2KView® video capability allows you to add cameras as part of the monitoring system - for example a camera in the engine room - or the cameras can be used as part of the security system. The control functionality gives you the ability to manage your electrical system; for example, you can turn lights or pumps on or off directly from N2KView® and even tell if the lights or pumps are burned out and not working. Lastly, the fuel management function uses information from the fuel flow monitor, tank monitors, and GPS to provide advanced information like distance and time to empty as well as fuel rate and fuel economy..
N2KView® software can run on your vessel's computer (PC) with a USB License Key or on standalone products like Maretron's TSM810C display or the Maretron Black Box (MBB300C) vessel monitoring computer.
If you want to run N2KView® software on your vessel’s computer, you will need either a Maretron USB100 or an IPG100, which are necessary to get sensor information from the NMEA 2000® network to the computer.
There is also a mobile version of N2KView® which runs on iPhone or iPad, or an Android device and connects to the NMEA 2000 network through the IPG100.
See section 8.1 for more details and examples of how to configure N2KView and N2KServer.
2 Software Version
This manual corresponds to N2KView Version 6.3.0 and N2KServer Version 3.6.
This manual is applicable to versions of N2KView running on the following platforms
· PC
· Macs
· Maretron MBB300C
· Maretron TSM800
· Maretron TSM800C
· Maretron TSM810C
· Maretron TSM1330
· Maretron TSM1330C
· Apple iPhone
· Apple iPad
· Android 3.2 phones and tablets including Nook Color, Nook Tablet and Kindle Fire.
3 Software Editions
Beginning with Version 4.0.0, N2KView is offered as a single user complete package will full functionality of all the previous modules.
In version 4.0.0, the following functionality was added
· Bridge Navigation Watch Alarm System (BNWAS) This is not available on the Mobile versions.
· Differential Temperature Monitoring
· SMS Signal Strength Component.
· The Connections Dialog has been re-worked to allow you to enter the Serial number of the IPG100 connecting you with the NMEA 2000 bus
In version 5.0.0, the following major changes were made
· Complete rework of the User Interface to support touch screens
· Screen Selection components allow you to add a control to any screen that, when pressed, will jump you to a screen of your choice.
· 2x1 Indicator components allow multiple lines of text
· Breaker/Switch groups
· Alert Detail shows alert history
In version 5.0.4, the following features were added
· Conditional Alerts
· New Parameters for Anchor Distance and Position
· Breakers are shown in the Alert Detail Dialog for Remote Breaker Tripped Alerts
In version 5.1.0, the following features were added
· Sending of parameter data to the Maretron Telemetric Cloud Service.
· Global log of Alert history events
In version 5.1.6, the following features were added
· Multi-line Text Components
· Filtering of Alerts in Alerts Setup dialog
· New Digital Control with colored background
In version 5.1.7, the following features were added
· Alert Vessel Mode table
In version 5.1.8, the following features were added
· Added an Action Text Field to Alerts.
In version 6.0.0, the following features were added
· The ability to display the screen of a MBB300C remotely as a web page.
In version 6.0.5, the following features were added
· The BNWAS function was extended to allow resetting through an external input.
In version 6.0.10, the following features were added
· The ability to send and receive free format text messages through a SMS100, including embedded parameter values.
· Controls can be created on top of video controls.
In version 6.0.12, the following features were added
· A new comprehensive anchoring package to assist with all phases of Anchoring.
· Reception of video from Axis cameras with password protection.
In version 6.0.14, the following features were added
· Support for Axis Cameras with new resolutions.
· Support for direct transfer of Configurations between all implementations of N2KView and also to the IPG100.
· An Active Button to switch between Day Mode and Night Mode.
· The ability to specify the instance number.
· Added support for new AC Phase PGNs.
· Allow Alert Emails and SMSs to be transmitted only in certain Vessel Modes.
In version 6.3.0, the following features were added
· Support for DC Chargers, Xantrex Converters, Thrusters,
· New parameters for Total DC Current, Set and Drift, Shaft Seal Temperature, Vessel Speed Components
· Momentary OFF Buttons. The momentary button control has been removed; there is now a single button control that can be set to Toggle, Momentary ON, or Momentary OFF.
· Lock and Unlock buttons have been added to the AC and DC Breaker Status dialog, and the dialog can be opened by a long click on the name of the switch controls.
· New Alert type for Door Entry Alert (for security functionality)
· Switch Actions on Alerts.
· The embedded parameter list used in emails, SMSs, and Textual displays has been extended.
· New Control Types of Digital2x1, Digital3x2, Digital4x3,Gauge4x5, Status Bars and Switch 6x1 to allow for more dense screen layouts.
· Screen Status controls to allow a summary of conditions on one screen to be seen on another.
· Improved navigation between screens using Back, Home, and Vessel Modes
· Improved layout editing using key presses to line up components.
· Password protection of a screen.
·
4 Prerequisites
4.1 N2KView
The following requirements must be met in order to successfully run N2KView on a PC or Mac.
· License – this is supplied on a USB Dongle.
o If running on a PC, connecting to the NMEA 2000 network through a USB100, the USB Dongle must be plugged into the PC.
o If running on a PC, connecting to the NMEA 2000 network through an IPG100, the USB Dongle may be plugged into the PC or the IPG100.
o If running on a Mac the connection to the NMEA 2000 network must be made through an IPG100 and the USB Dongle must be plugged into the IPG100.
· Operating System:
o Windows XP Home Edition/Professional, or Microsoft Vista (32 or 64 bit) or Windows 7 through 10 (32 or 64 bit).
§ N2KView runs under the Adobe Integrated Runtime (AIR). From version 6.3.0 the AIR runtime will be bundled with N2KView.
§ Please contact Maretron Support at (866) 550-9100 if you have any questions.
o N2KView will also run under MacOS. Users should follow the following instructions to install N2KView manually …
§ Install AIR (Adobe Integrated Runtime)
![]() Go to https://airsdk.harman.com/runtime,
and press this button to start the download.
Go to https://airsdk.harman.com/runtime,
and press this button to start the download.
§ Install N2KView
Go to the following URL. http://www.maretron.com/products/N2KView.php to download and install.
After installation the AIR update process will take care of future updates.
· CPU: Minimum Pentium® 4 or Equivalent, Recommended Pentium® 4, 3.0 GHz
· Memory: Minimum 1GB RAM, Recommended 2 GB RAM on Windows XP and 2GB RAM on Windows Vista.
· Hard Drive Space: 4 GB
· Video Card: Minimum 128 MB memory, Recommended 256 MB. N2KView is a graphics intensive program which will allow more complex screen layouts with high power graphics engines.
· Network Connection: 10BASE-T or 100BASE-TX, or 802.11a/b/g, or 3G. With the TSM800C, TSM1330C or MBB300C, the network connection is only required for software updates and to connect with IP cameras
· Display: Minimum 1024x768 Resolution, 32-Bit Color Video
· Multiple Monitor Support: Dedicated Video Cards with Minimum 64 MB memory per monitor
· Touch Screen or Mouse with Windows Compatible Driver
· Keyboard (for assigning user-defined titles to components, entering passwords and connection information)
4.2 N2KServer
N2KServer is required on a PC when interfacing to the NMEA 2000 network through a USB100. The following requirements must be met in order to successfully run N2KServer on a PC:
· Operating System: Windows XP Home Edition/Professional, Microsoft Vista (32 or 64 bit), Windows 7 through 10 (32 or 64 bit)
· CPU: Minimum Pentium® 4 or Equivalent, Recommended Pentium® 4, 3.0 GHz
· Memory: Minimum 512 MB RAM, Recommended 1 GB RAM
· Hard Drive Space: 40 MB
· Video Card: Minimum 128 MB memory, Recommended 256 MB
· USB Ports: Two 1.1 or 2.0 compatible ports
· Network Connection: 10BASE-T or 100BASE-TX, or 802.11a/b/g
· A NMEA 2000 gateway. Currently, compatible gateways include the following:
o Maretron USB100 with firmware revision 1.7.1 or greater (contact Maretron for any necessary firmware updates) with a Maretron USB100 Windows driver dated 8/3/2007, version 1.0.0.0, or a more recent revision. This version of the driver is installed by default by the Maretron N2KServer Setup Wizard, but you may need to manually update the USB100 driver using the Windows Device Manager in order to use the updated driver if you are using a NMEA 2000 gateway you installed previously to installing N2KServer. N2KServer can operate with earlier versions of USB100 drivers, but will not automatically recover when NMEA 2000 power is lost or when the USB gateway is unplugged from the computer and then plugged in again.
o Maretron IPG100 with firmware revision 4.0.1 or greater. This is a bridge between the NMEA 2000 network and Ethernet. N2KServer runs on the IPG100, so there is no requirement to run it on the PC if the USB License Key is plugged in to the IPG100.
· Mouse
· Keyboard
5 N2KView System Features
- Provides monitoring of a wide variety of NMEA 2000 data (see section 9.6 for a complete list of available data types):
· AC Bus Parameters (Average and Phase specific)
· AC Generator Parameters (Average and Phase specific)
· AC Utility Parameters (Average and Phase specific)
· AC Phase Parameters
· Air Conditioners (requires a compatible Air Conditioner)
· Anchoring with Anchor Watch Alert
· Bridge Navigation Watchkeeper Alarm System (BNWAS)
· DC
· Depth
· Electrical Distribution (to control Breakers requires a compatible breaker)
· Engine
· Engine Warning
· Environment
· Fuel Management
· GPS
· Heading
· Humidity
· Ice Makers (requires a compatible Ice Maker)
· Indicators
· Navigation
· Pressure / Vacuum
· Rudder
· Speed/Distance
· Switch (to control Switches requires a compatible breaker)
· Tank
· Temperature and Differential Temperature
· Text
· Time/Date
· Transmission
· Transmission Warning
· Vessel
· Video
· Watermakers (requires a compatible Watermaker)
· Wind
- Provides ability to control compatible NMEA 2000 switches and circuit breakers.
- Client/Server architecture allows monitoring from anywhere in the world with an internet connection. If a direct connection to the boat is not possible, then Maretron’s Cloud Service may be used to make the connection.
- Alerts N2KView provides the ability to monitor a wide variety of NMEA 2000 data for values going outside predetermined values, to add gating conditions under which the alert will be enabled, and to perform one or more of the following actions when an alert value goes out of bounds and the gating condition is met
· Display the alert on any or all N2KView Screens connected to an N2KView Server on the NMEA 2000 network. This includes N2KView stations connected remotely through an Internet connection.
· Sound one or more Annunciators connected to the NMEA 2000 network.
· Sound the PC Speaker on local and/or remote Alerts.
· Email alert details to one or more email addresses, including cell phones.
· Text (SMS) alert details to one or more cell phones.
- SSL Encryption with password protection for security against eavesdropping.
- Password protected configuration files
- Password protected server login
- Gauge components with programmable warning and fault ranges, and optional tracking on minimum / maximum values.
- Digital components with programmable warning and fault ranges
- Unlimited number of user-defined screens
· User graphics and pictures may be added to any screen as a background
Individual screen layouts may be imported and exported to other copies of N2KView.
- Easy transfer of configurations between N2KView installations on PCs, IPG100, MBB300C and TSM810C
6 Quick Install
This section will help you install the software on a PC for the first time and get it running as quickly as possible with basic settings.
The following options are possible, all require a license.
PC and USB100: The PC version of N2KView may connect to the NMEA 2000® network through a USB100 connected to a USB port on the same PC. This requires a license key plugged into another USB port on the same PC.
PC and IPG100: The PC version of N2KView may connect to the NMEA 2000® network through an IPG100. The IPG100 may be on the same network (a LAN connection), on a different network through a gateway (a WAN connection) or through the Maretron Cloud (a cloud connection). This requires a license key plugged either into the PC running N2KView, or into the IPG100.
Mac and IPG100: The Mac version of N2KView may connect to the NMEA 2000 network through an IPG100 only. The IPG100 may be on the same network (a LAN connection), on a different network through a gateway (a WAN connection) or through the Maretron Cloud (a cloud connection). This requires a license key plugged into the IPG100.
TSM/MBB with NMEA 2000 connection: The TSM800C, TSM810C, TSM1330C, MBB200C and MBB300C have a pre-licensed copy of N2KView built-in and just require connecting to the NMEA 2000® network. No key is required.
TSM/MBB with IPG100: The TSM800, TSM1330 and MBB100 have N2KView pre-installed and must be connected to an IPG100 through Ethernet. This requires a license key must plugged into the IPG100.
6.1 Install IPG100 or USB100 if applicable
Please refer to the Maretron IPG100 User’s Manual or the Maretron USB100 User’s Manual.
6.2 Get the N2KView Install Program
From the blue Maretron USB Drive.
a. Insert the blue Maretron USB Drive into your computer. Double click on the menu.html file to display the USB Drive’s web page.
b. Click on the Install PC Software button
c. Click on the N2KView button to start the installer.
From the Maretron website.
a. Go to the following URL. http://www.maretron.com/products/N2KView.php to download and install.
b. Click on the link for the PC installer to download the installer to your computer.
c. Run the installer after it has downloaded
6.3 Install N2KView
The “License Agreement” screen will be shown next. Please read the license agreement carefully. If you agree with the terms of the license agreement, please select “I accept the agreement” and then click “Next >“ to continue the installation. If you select “I do not accept the agreement”, the installer will terminate without installing the software.
6.3.1 Accept the License Agreement
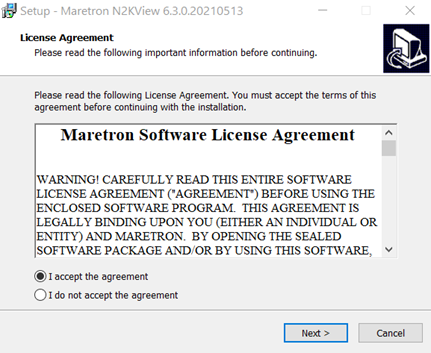
Figure 1 – N2KView Installation License Agreement Page
6.3.2 Select Additional Tasks

Figure 2 – Additional N2KView Installation Tasks
If the USB100 is being used as the NMEA 2000® bridge, then N2KServer and USB Drivers need to be installed. Please check the box. If the IPG100 is being used as the bridge, the box does not need to be checked.
6.3.3 Continue with the Installation
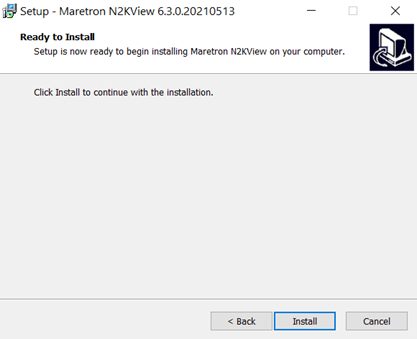
Press Install.
6.3.4 Hardware Setup
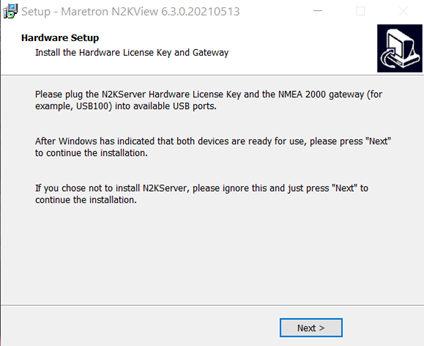
This screen can be ignored if you chose to not install N2KServer.
Press Next> to continue.
6.3.5 Finish
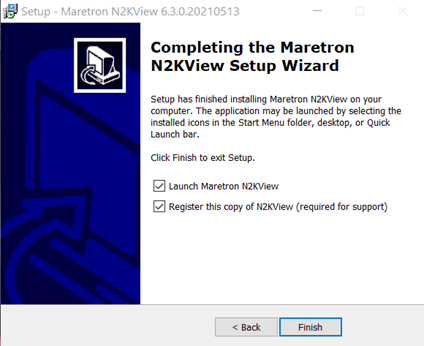
Figure 3 – Maretron N2KView Installation Wizard Completion Page
After pressing Finish, you will be given the opportunity to register your software and start using N2KView. Please make sure to register your software in order to qualify for technical assistance.
The installation is now complete. To run the N2KView software, click on the N2KView icon in the Start Menu, desktop, or Quick Launch bar. When N2KView starts you will be given the option to:
1. Enter Demo Mode, which has simulated data and does not require a license.
2. Accept the terms of the license agreement and start monitoring live data. This will require a license and a gateway to the NMEA 2000® network.
6.4 Installing Cameras
N2KView is designed to display data from IP cameras produced by AXIS Communications. The cameras are connected to the computer running N2KView via Ethernet. While all Axis cameras with the VAPIX streaming protocol are supported, the following cameras have been thoroughly tested by Maretron.
- Axis 212 PTZ Network Camera. This is a wall-mounted camera with software pan Tilt and Zoom.
- Axis 215 PTZ Network Camera. This is a sophisticated camera with hardware Pan Tilt and Zoom. It requires a 12V power supply which is supplied with the camera.
- Axis P3301 Fixed Dome Network Camera
- Axis Single Video Server 241S
- Axis Quad Video Server 241Q
- Axis Q7401 Video Encoder
- Axis Quad Video Server 240Q
- Axis M3113 Network Camera
- Axis M3114 Network Camera
- Axis M3343 Network Camera
- Axis M5525 PTZ Network Camera
- Unknown Axis Camera - If any other Axis Network Camera is used, N2KView will not know which picture sizes are valid for the camera, and you will need to enter the value manually.
- Unknown Axis Quad Server - If any other Axis Video Server is used, N2KView will not know which picture sizes are valid for the server, and you will need to enter the value manually.
The video servers allow the connection of analog cameras to the video server using co-axial cable, which then serves the video to N2KView via Ethernet. The cameras require a separate 12V power supply.
In addition, the Hatteland Seahawk range of cameras are also supported.
Connection of IP cameras requires knowledge of computer networks to allocate an address to the cameras. The camera is identified by N2KView by this address (see 8.5 for more information). In simple networks, this address (the IP address) can be permanently set inside the camera; in more complex networks a server can dynamically allocate the IP address to the camera, and the camera addressed though its name. The software and installation manual supplied by Axis Communications must be used to set up the camera’s address.
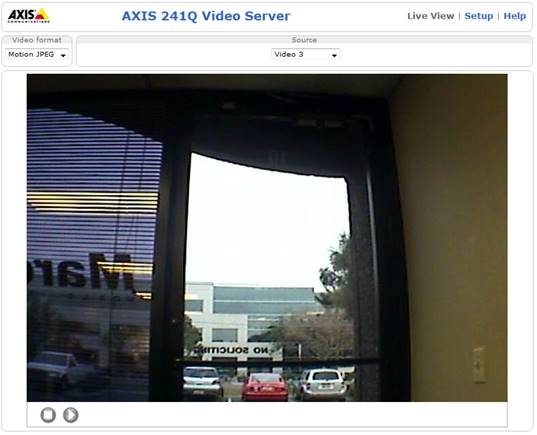
Section 19 gives a step-by-step example of setting up the Axis Quad Video Server 241Q.
6.5 Run N2KView
Note: Before running N2KView in Live Mode, please make sure you are connected to a USB100 on the same computer or on a Maretron IPG100 whose IP address is accessible from this computer. The MBB300C, TSM800C, TSM810C, and TSM1330C products have a built-in IPG100 and require connecting directly to the NMEA 2000® bus.
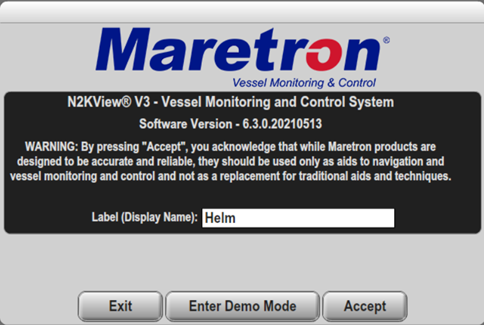
N2KView will start up with the following disclaimer screen.
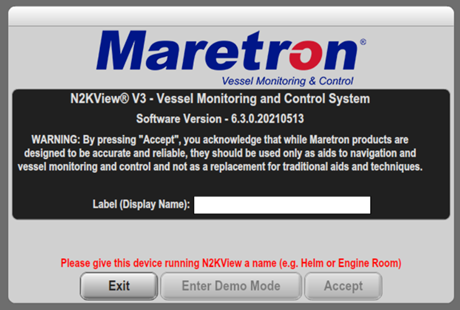
Figure 4 – N2KView Startup Disclaimer Screen
Please enter a Label (Display Name) that uniquely identifies the device on which N2KView is running. This name will be used in the Alerts Module to identify to you which of your devices generated an Alert, and which device was used to acknowledge the alerts. The name may be changed from the Configuration Dialog.
You are required to press Accept with the left mouse button and thereby acknowledge this warning message before N2KView will run in Live Mode. Clicking Accept with the right mouse button will force N2KView to the top left of the screen.
Alternatively, you may Enter Demo Mode. In Demo Mode, you will not be able to view live data; instead simulated data will be provided to stimulate the controls. You will be able to create Configurations and transfer them to an IPG100 or other copies of N2KView in this mode. Clicking Enter Demo Mode with the right mouse button will force N2KView to the top left of the screen.
The first time you run N2KView in Live Mode, you must select the device through which the connection to the NMEA 2000® bus will be made. This is not required in the devices that connect directly to the NMEA 2000® network (i.e. MBB300C, TSM800C, TSM810C and TSM1330C)
This is done through the following steps:
a. Click (or touch) anywhere inside the N2KView screen to display the screen tabs.
Figure 5 – N2KView Window with Tabs Displayed
b. Click on the Commands & Settings tab (on the right of the screen) to display the buttons to access the Settings dialogs
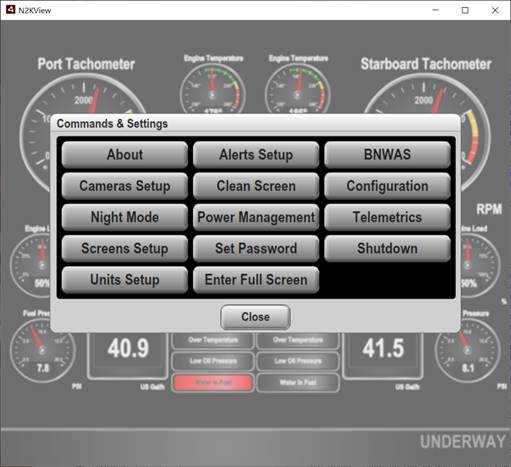
c. Click on the Configuration button to display the Configuration sub-menu.
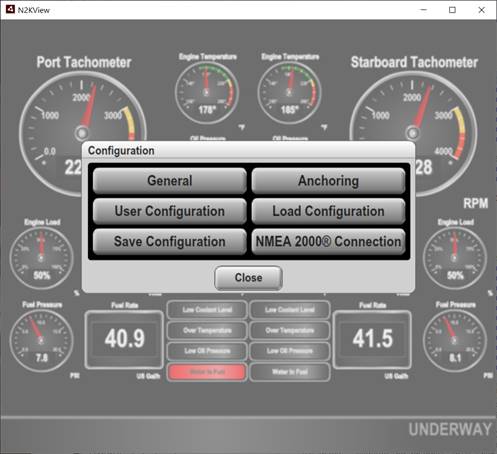
d. Click on the “NMEA 2000® Connection” button to display the NMEA 2000® Connection dialog.
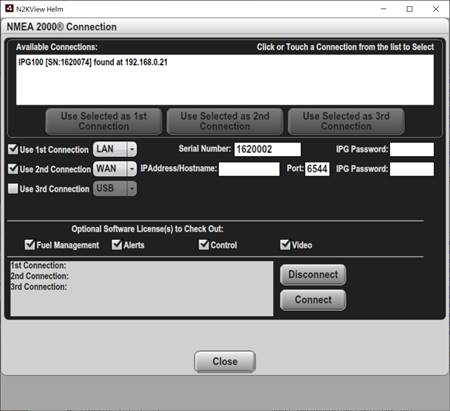
Figure 6 – NMEA 2000® Connection Dialog
e. Ensure that N2KView is not connected to a Server by pressing the “Disconnect” button. While N2KView is connected you are not able to edit fields.
In this section of the manual, we will only use the 1st Connection. The other lines provide alternative ways to connect so that you do need to change the configuration each time to leave the boat and move (for example) from a LAN connection to a Cloud connection.
f. If you are running on a PC connected to a USB100, you will see the line “PC [USB Key:nn] found on local PC” in the list of Available Connections at the top of the dialog. Click on the line in the list, and then press the Use Selected as 1st Connection button.
This will populate the 1st Connection for a USB connection.
g. If you are running on a PC or Mac and you have an IPG100 running on the same Ethernet network as the PC or Mac, then you will see the line “IPG100 [SN:nnnnnnn] found at nn.nn.nn.nn” in the list of Available Connections at the top of the Dialog. Click on the line in the list and press the Use Selected as 1st Connection button.
This will populate the 1st Connection for a LAN connection as shown below. The Serial Number will be entered into the line; if you entered a password in the IPG100, enter the same password in the Password box.
![]()
h. If you are running on a PC or Mac and you have an IPG100 running on a different Ethernet network as the PC or Mac, this cannot be detected by N2KView. You will need to enter the IP Address or Hostname of the gateway where you have established port forwarding to the IPG100. Check the Use 1st Connection box, select WAN from the list of methods and then enter the IP Address/Hostname and the Port of the global port. This is the most difficult way to connect N2KView and the IPG100, and should only be attempted by IT professionals
This will populate the 1st Connection for a LAN connection as shown below. The Serial Number will be entered into the line; if you entered a password in the IPG100, enter the same password in the Password box.
An example of this is shown below:
![]()
In the “Password:” text box, enter the same password that you entered in the IPG100.
i. If you are running on a PC or Mac and you are connecting to the IPG100 through the Maretron Cloud Services, check the Use 1st Connection box, select Cloud from the list of methods and then enter your Cloud Username and the Password from your IPG100. Maretron Cloud Services solves all the complex problems of accessing your boat remotely, and is the preferred method of making such connections.
![]()
j. If you are connecting to an older version you may be asked to request which of the optional modules for N2KView you wish to use; select the appropriate licenses that must be checked out from the server.
k. Click “Connect”. The Connection State part of the window will blink “Connecting…” for a few seconds. It will then either display “Connected” if the connection was successfully made, or display a message indicating that the connection was not made and suggesting further action to take.
It will also show details about the connection made.

If the connection is not made, please check the following:
1. Make sure the “Server Password” entered in N2KView matches the “Server Password” entered into the IPG100; the password in the IPG100 is set from a Maretron DSMxxx or N2KAnalyzer. (The USB100 has no password.)
2. If using the WAN mode, make sure the “IP Address/Hostname” of the IPG100 is reachable from PC running N2KView. (If this is a problem we suggest using Maretron Cloud Services, or contacting an Internet Technician to help set up your network with the correct port forwarding.)
3. If you are using Cloud Services, make sure that you have a Cloud Services account with Maretron, and that Maretron Cloud Services is enabled in the IPG100. Also check that your Cloud username is correct.
3. Make sure you have appropriate instruments on the NMEA 2000 network to provide the data you are trying to view on the N2KView screen.
4. Make sure that the instances that are being monitored correspond to the instances being transmitted. You can set the instance number of the component to “Any” to make sure that there is any data of that type on the bus.
7 Upgrading N2KView
As N2KView is released with new features on a regular basis, you will want to keep N2KView upgraded to the latest version.
7.1 Automatic Updates
If your PC running N2KView, TSM1330, TSM1330C, TSM800, TSM800C, TSM810C, MBB300C, or MBB100 has access to the Internet through the ship’s computer network, N2KView will check on each startup if a later version is available. If you are ready for an update, then you will asked if you want to update.
Follow the instructions given. On the TSM800, TSM1330 and MBB100, the system will restart about 6 minutes after the update is started. On the TSM800C, TSM810C, TSM1330C and MBB300C, you will be prompted at the end of the installation and the system will restart immediately.
Automatic updates may be disabled from the Configuration Dialog. (see 9.4.6.1).
7.2 Manual Updates
If you do not have access to the Internet, your copy of N2KView will need to be upgraded manually. You will need to load the upgrade files from the Maretron website onto a USB Flash Drive (on a computer that does have Internet access) and then insert the USB Flash Drive into the computer, TSM800, TSM800C, TSM810C, TSM1330, TSM1330C, MBB100, MBB200C or MBB300C while N2KView is running.
Visit the web page <http://www.maretron.com/products/N2KView.php> and click on the Downloads tab for the latest instructions on how to update N2KView manually on a PC or Mac.
Visit the web page <http://www.maretron.com/products/tsm800c.php> and click on the Updates tab for the latest instructions on how to update N2KView manually on a TSM800C.
Visit the web page <http://www.maretron.com/products/tsm810c.php> and click on the Updates tab for the latest instructions on how to update N2KView manually on a TSM810C.
Visit the web page <http://www.maretron.com/products/tsm1330c.php> and click on the Updates tab for the latest instructions on how to update N2KView manually on a TSM1330C.
Visit the web page <http://www.maretron.com/products/mbb300c.php> and click on the Updates tab for the latest instructions on how to update N2KView manually on a MBB300C.
Visit the web page <http://www.maretron.com/products/mbb100.php> and click on the Documentation tab for the latest instructions on how to update N2KView manually on a MBB100.
Visit the web page <http://www.maretron.com/products/mbb200c.php> and click on the Documentation tab for the latest instructions on how to update N2KView manually on a MBB200C.
Visit the web page <http://www.maretron.com/products/tsm800.php> and click on the Documentation tab for the latest instructions on how to update N2KView manually on a TSM800.
Visit the web page <http://www.maretron.com/products/tsm1330.php> and click on the Documentation tab for the latest instructions on how to update N2KView manually on a TSM1330.
8 General Concepts
8.1 Data Security and Encryption
Making your vessel’s data available over local networks or the internet presents multiple security concerns. First, it is desirable to keep anyone from viewing your vessel’s data without authorization. Second, and more important, it is imperative that no unauthorized persons be able to place data onto your vessel’s NMEA 2000 network.
The N2KView system protects your vessel’s data with multiple levels of protection.
First, any data that passes between the IPG100 and N2KView is protected using industry-standard SSL encryption. This encryption standard is widely used to protect financial information on the internet. Each communication session negotiates a random encryption key every time a connection is established. This makes the data secure over public and private Wi-Fi networks, as well as the internet.
Second, each N2KView station that wishes to connect to an IPG100 must authenticate itself by means of a server password. The server password is transmitted by the N2KView station to the N2KServer server over the encrypted communication link. The N2KServer compares the server password to the one it was programmed with. Only if the server password received from the station matches the server’s stored password is the station granted access to the NMEA 2000 network data.
8.2 Using Maretron’s Cloud Server
To use Maretron’s Cloud Server, these steps should be followed:
Establish the key number that will identify your vessel to the Real Time Cloud Server.
· If you have a N2KView license key plugged into the IPG100, the serial number of the license key will be the key number.
· If not, the serial number of the IPG100 will be license key.
Log in to https://rtcs.maretron.com and create an account for the Cloud Services. You will need to provide a name and password for your account, the key number that will be associated with your account, and decide on a level of data that you will require. The levels are
· 25 GByte per month – This will be suitable for most users who are not monitoring video remotely.
· 50 GByte per month – This will be suitable for users that have little remote video monitoring.
· 100 GByte per month – This should be suitable for users with high remote video requirements.
· You can sign up for a trial period of the first option at no cost to evaluate the service before committing.
Enable Cloud Services on the IPG100, using N2KAnalyzer . At this point the IPG100 will start trying to make a connection to the Cloud Server. Data from the NMEA 2000 bus will not be transmitted to the Cloud Server when no N2KView clients are connected, but there will be a small amount of data transmission to manage the link.
On the N2KView Client, select Cloud Services in the Connection Dialog, and enter the name you specified in the account. If the IPG100 is protected with a password (recommended), then this password must be entered in the Connections Dialog. Do not enter the password that you used to create your account.
Add controls and alerts to N2KView so that you can monitor your use of bandwidth.
8.3 NMEA 2000 Considerations
This section describes some requirements for the NMEA 2000 networks to be monitored with N2KView.
8.3.1 Instancing
The one aspect of NMEA 2000 that you need to be aware of as a user of N2KView is the concept of instance numbers, or instancing. To enable parameters from different devices to be distinguished, an instance number is associated with the source of each parameter. This may be done as a Device Instance or a Data Instance, depending on the message format used to transport the data on the NMEA 2000 bus. The user does not need to know whether Device Instancing or Data Instancing is used to configure N2KView. When configuring each component on the display, the instance number associated with the source of the data should be known to ensure that the component is monitoring the correct instance of the parameter.
For example: when configuring a control to monitor the Port Engine RPM, the instance number should be set to 0; setting it to 1 would monitor the RPM of the Starboard Engine.

Figure 7 – Setting Instance Number
For simple configurations, where there is only one source of data, N2KView allows the Instance Number to be set to “Any”. If this is chosen, the component will lock on to the first matching parameter received on the NMEA 2000 bus, regardless of its Instance Number. If there are more than two matching parameters on the bus, this will lead to unpredictable behavior. If there is only one matching parameter, it is an easy way to set up the component without knowing what the real Instance Number is.
Instance Numbers can either be allocated to the Device as a whole (Device Instancing) or to individual data elements (Data Instancing).
8.3.1.1 Device Instancing
The device instance is an eight-bit value (ranging between 0 and 255) that every NMEA 2000 device transmits when it joins the bus and upon request thereafter. This becomes important when you have multiple devices that transmit the same data. It is possible, for example, to have two GPS antennas on a vessel, with one serving as a primary antenna and others serving as backups. If this is so, the NMEA 2000 standard requires that the two different antennas have two different device instances. If you are using a certified NMEA 2000 product, the NMEA 2000 standard requires that a user be able to set the device instance in each product. Consult the device documentation or contact your device manufacturer in order to determine how to set the instance into a particular device.
8.3.1.2 Data Instancing
Certain NMEA messages, such as those from batteries, tanks, engines, and transmissions, have data instances embedded in the messages. These data instances are used, if programmed, to relate data to specific data sources. Data instances are also required by the NMEA 2000 standard to be field-programmable, so please consult your device’s documentation for details on how to program this value.
In order to support “plug-and-play” operation, if N2KView receives the same data from multiple devices that have the same device instance programmed, it will “lock on” to the first unit it receives data from until either 1) it stops receiving data from the first unit, in which case it will switch to the second unit, or 2) it starts receiving data from another unit with higher Priority, in which case it will transmit the data from that unit.
8.3.2 Data Source Types
The NMEA 2000 standard provides for the transmission of data from similar devices, but for different sources. For example, the NMEA 2000 standard supports six different types of fluid tanks: Fuel, Oil, Live Well, Fresh Water, Waste Water, and Black Water. It further supports up to sixteen tanks of each of these types. It is the responsibility of the person installing the NMEA 2000 system to ensure that each tank level sender is programmed with the appropriate fluid type and tank instance.
8.3.3 Sensor Selection
Of course, one key to making the N2KView System work is making sure that your NMEA 2000 network has the proper sensors to provide the information you wish to monitor using N2KView. Section 9.6 on page 183 contains a listing of all of the data types that can be monitored using N2KView.
To see what Maretron sensors provide data for each of the listed data types, you may download the latest Maretron Capability Matrix from the Knowledge Base on the Maretron website.
<http://www.maretron.com/support/knowledgebase/phpkbv7/article.php?id=468>
9 N2KView
This section details the configuration and operation of N2KView.
9.1 General Concepts
9.1.1 Touch Screen Operation
N2KView was designed so that all functions in operational mode can be performed with either a mouse or a touch screen.
9.1.2 Keyboard Operation
A keyboard is suggested to configure N2KView. There are a number of fields that need to be entered with text. In normal operation, if a keyboard is connected, short cuts can be used to easily navigate from screen to screen.
In case there is no keyboard connected to the computer, a virtual keyboard will be displayed on the screen the first time there is a need to enter textual data. Pressing a key on a physical keyboard will remove the virtual keyboard from the display. If you are using a physical keyboard, and then unplug the physical keyboard, this action cannot be detected by the program and the virtual keyboard will not appear. The program needs to be restarted to enable the virtual keyboard again.
9.1.3 Parameters
The key concept of N2KView is the display of parameters. A parameter is a piece of information about some function of the vessel, such as engine speed or barometric pressure. In addition a particular instance of that data type will also need to specified, e.g. the speed of the Port Engine and possibly a source, e.g. Port Fuel Tank Level.
All of the available parameters that N2KView can display are listed in Section 9.6 on page 183. A device is required to be connected to the NMEA 2000 bus and producing the relevant data for it to be displayed.
9.1.4 Components
Each parameter may be displayed on a User-defined Screen using a component. A component is a graphical display that is generally dedicated to the display of the value of a parameter. Examples of components include the digital display, a gauge, or a bar graph. A complete listing of available component types appears on page 124. If data is not available for a component, the component will display a dash (“-“), or two dashes (“‑ ‑“), and the indicators for gauge type components will be at the end stop (or peg). More complex components such as the compass will show a dimmed needle to indicate data not being available. Where secondary data is not available to perform a calculation to get the required parameter, every effort is made to inform the user what secondary data is missing. (e.g. If variation is not available to convert Magnetic Heading to True Heading the digital display will show “No VAR”.)
9.1.5 Favorite Screens and Parameter Display
N2KView employs the concept of user-defined screens. You can set up your own screens with your layout to display a group of components which generally will display related parameters, such as engine data, navigation data, tank levels, and so on. N2KView comes with the Alerts screen plus pre-defined favorite screens: Engines, DC Systems, AC Systems, Navigation, Environment, Tanks, and Miscellaneous. You may use the user-defined screens as provided, modify them, or delete them and create your own screens from scratch. There is no limit to the number of screens you can create.
Some (or all) of these screens can be set as favorite screens in the Screen Editor dialog, and can be selected directly from the drop down tabs that appear at the top of the screen when the screen is clicked or tapped. The default is that all screens are created as favorite screens.
The set of user defined screens, plus the configuration of the alerts and cameras is called the system configuration. The system configuration may be saved to disk, either as a backup or for transfer to another computer, or saved directly to the IPG100 , where it may be downloaded by another N2KView, or transferred directly to another copy of N2KView. The system configuration may also be saved to a USB Memory Stick and transferred to another computer.
9.1.6 Protecting the System Configuration
Once the configuration has been set up, it may be protected by a password, which prevents further authoring of the configuration by unauthorized users..
The authoring password is set in the Set Password Dialog (see section 9.4.5).
Any attempt to enter a dialog that has the potential to change the configuration will result in the following Enter Password dialog being displayed.
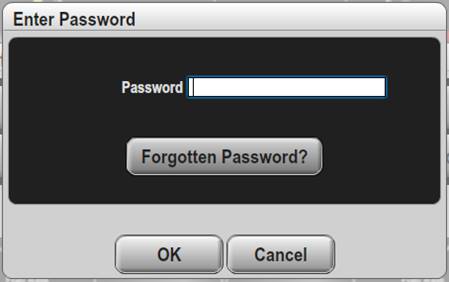
The password is encrypted and stored within the Configuration File itself. Should you forget the password, Maretron can help you retrieve it after sending a copy of your Configuration File to Maretron Support. Pressing the Forgotten Password? button will give instructions on how to get your configuration file.
9.1.7 Grid Layout Concepts
A user-defined screen in N2KView is laid out on a grid of squares. When you create a favorite screen, you determine the layout by setting the width and height in terms of the number of squares that will be displayed on the screen. When the screen is displayed it expands to fill the N2KView window as much as possible (or the entire computer screen if operating in full screen mode). You should choose a number of grids that is fairly small. When you create or move components, they snap to the grid intersections, so the fewer grids you have in your layout, the easier it is to place and align components. It is also important to choose a number of grids that matches the aspect ratio of the window in which you plan to run N2KView, in order to minimize blank space in the N2KView window. For example, if you are creating a favorite screen that is designed to run in full screen mode on a computer with a typical 4:3 aspect ratio, you may wish to make the favorite screen 40 grids wide by 30 grids high, so that the computer screen is completely filled when N2KView is operating in full-screen mode. However, you may wish to run N2KView simultaneously with a chart plotting program, letting the chart plotting program occupy the left half of the computer screen and letting N2KView occupy the right half of the computer screen. Choosing a favorite screen size of 20 grids wide and 30 grids high would allow you to completely fill this window with components. If you choose a favorite screen size and decide later that you wish you had chosen different height and width values, you can always change these at any time (see Section 9.4.9.5 for details).
If you have licensed the Alerts Module, the Alert Status bar will be created below the grid on all the screens, and will have a height equal to about ½ inch.
9.1.8 Hardware License Key
The licensing of the N2KView Vessel Monitoring and Control System is controlled by the use of a Hardware License Key, which is often referred to by the term “dongle”. This Hardware License Key may be installed in the PC running N2KView or in the IPG100. The software tests for the presence of the appropriate hardware license key before it begins operation. If the hardware license key is not detected, the software will not display live data. After the software starts running, it continually tests for the presence of the hardware license key.
If the license key is installed on the IPG100, the IPG100 will allocate them to the N2KView stations on a first come first served basis.
If the license key is installed on a PC, the PC may connect to the NMEA 2000 bus through a USB100. This is the recommended way of connecting PCs onboard, to reduce the possibilities of mal-functioning Ethernet devices or routers interfering with the vital operation of monitoring your vessel.
The TSM800C, TSM810C, TSM1330C, MBB200C and MBB300C do not require Hardware License Keys; the full license set is included with the hardware.
Currently N2KView licenses are all bundled together in the License Key. Older License Keys may only be licensed for part of the functionality.
9.2 Using N2KView
This section describes how to operate the N2KView program after it is installed.
9.2.1 First use
On running N2KView for the first time, you will be presented with the following dialog:
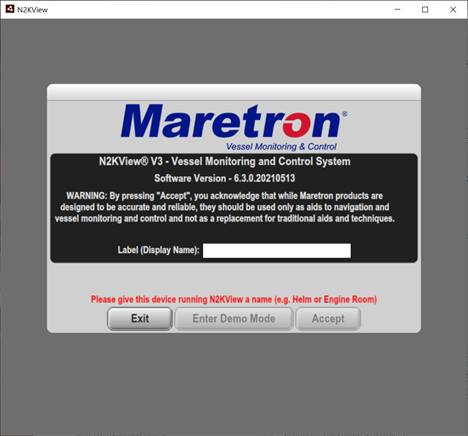
Label the device running this copy of N2KView by clicking in the white box, typing the name, and then press the Accept button. When generating and acknowledging alerts this label will help you identify the computer or mobile device originating the alert.
By pressing Accept, you are accepting the following agreement:
WARNING: By pressing “Accept”, you acknowledge that while Maretron products are designed to be accurate and reliable, they should be used only as aids to navigation and vessel monitoring and not as a replacement for traditional aids and techniques.
Pressing Enter Demo Mode will take you into demo mode with simulated data.
9.2.2 The Opening Screen
Subsequently, when you start N2KView, the program will display the same opening dialog and disclaimer message, and will show the name previously entered.
If you accept the warning, press the “Accept” button and the program will change into operational mode. If you do not accept the warning, press the “Exit” button and the program will terminate.
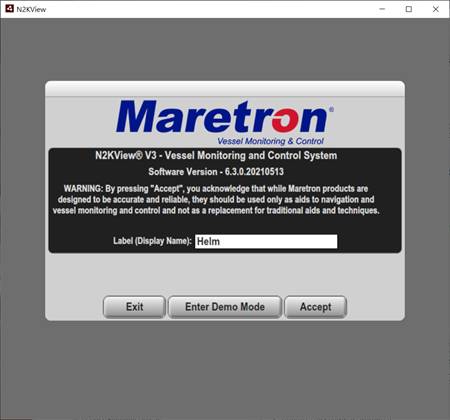
Figure 8 – N2KView Opening Dialog
Alternatively, pressing the Enter Demo Mode button will take you into a demo mode which showcases all the possible components with simulated data.
9.2.3 User-defined Screens
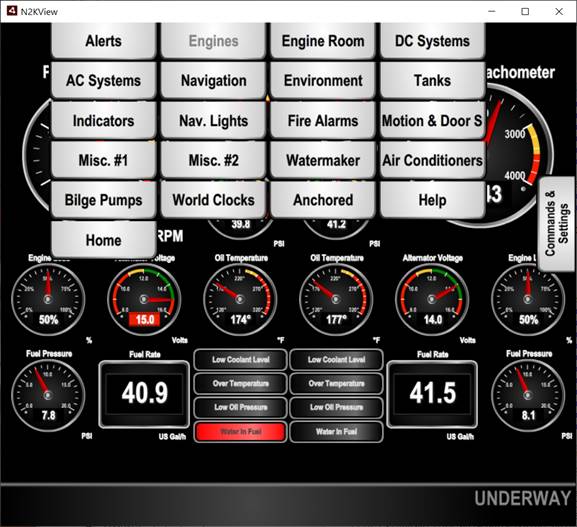
Once you have accepted the warning in the opening screen, it closes and a user-defined screen is displayed. A typical example of a such a screen is shown below.
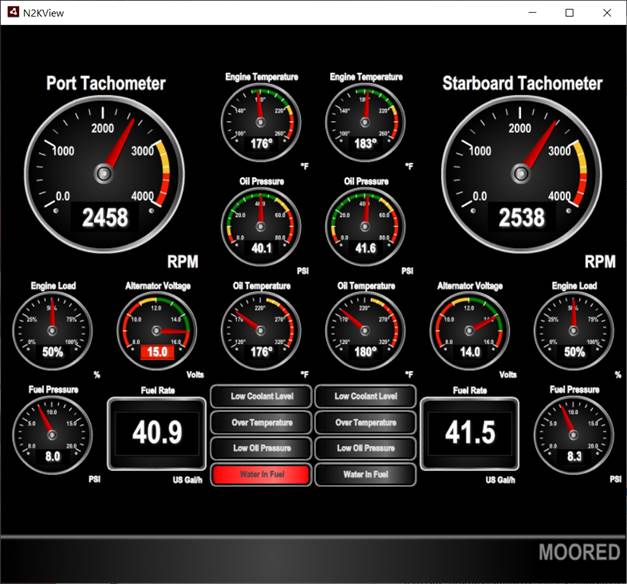
Figure 9 – Typical N2KView Screen
9.3 Operation
This section describes the activities that you may wish to perform with N2KView once it is fully configured and in operation.
N2KView will be configured with a number of User-defined Screens. These screens contain the controls that display the data received from the NMEA 2000 bus. Each screen may be customized with controls selected by the designer of the screen to suit the purpose of that screen.
The first screen is always the Alerts Screen and cannot be changed. The tab for the Alerts Screen will be semi-transparent if the Alerts feature is not licensed.
9.3.1 Changing Between User-Defined screens
Navigation between Screens has been reworked completely in N2KView 6.3.0. There are now a number of ways to set up your screens and navigate between them.
9.3.1.1 Favorite Screen Tabs
Along the top of the screen are tabs to allow you to access the favorite screens you have defined, as well as the Alerts Screen. Click on a screen tab to display the corresponding screen. The tab corresponding to the currently displayed screen is a shade darker than the other tabs.
![]() There
is one other tab on the right-side of the screen. This is not for screen
selection, and is used to navigate to the Commands & Settings Dialog. See
section 9.4.1.
There
is one other tab on the right-side of the screen. This is not for screen
selection, and is used to navigate to the Commands & Settings Dialog. See
section 9.4.1.
9.3.1.2 Keyboard
Use the left or right arrow key (ß or à ), or the page-up or page-down key to cycle between the different favorite screens.
Use the function keys.
- F1 – Go to a screen containing the word “help” in the title. The default configuration has such a page describing these shortcuts, or you can download the page from the Maretron website.
- F2 to F10 – Takes you to the nth favorite screen shown in the tabs
- Home – Go to a screen containing the word “home” in the title. If there is no such screen then the Alt Home function will be tried.
- Alt Home – Go to a screen containing the word “anchored” or “moored” or “underway”, depending on the Vessel Operating Mode.
- Backspace (or Alt ß) – go to the screen that you were previously viewing. You can go back 10 screens by repeating this.
- Alt à - undo the action of the backspace.
9.3.1.3 Screen Select Controls
Screen Select controls are placed by the designer of the screen to allow the user to jump directly to any user-defined screen (whether it has been marked as a favorite screen or not) by clicking on the control without needing the extra step of displaying the tabs. This can be very useful to minimize the number of tabs at the top of the screen by removing tabs to screens that are seldom used.
Screen Select controls may also have the Home, Vessel Mode, and backspace functions.
User-defined screens that are not favorite screens, cannot be accessed from the drop-down favorite screen tabs, or by using the left and right arrow keys. These are accessed only through the Screen Select controls, so one of your favorite screens must contain a Screen Select control to take you to that screen.
N2KView can be set to automatically cycle though your favorite screens from the General Configuration dialog. Screen changes occur every 10 seconds. If any user activity takes place, then the cycling is paused for 2 minutes.
9.3.2 Commands & Settings
In operational mode, press anywhere on the N2KView window to display the screen tabs. While the screen tabs along the top of the screen display your defined favorite screens, the tab on the right-hand edge of the screen allow access to the Commands & Settings Dialog. Section 9.4 describes the Commands & Settings Dialog and the functions they perform.
9.3.3 Switching Between Day and Night Mode
N2KView supports a Night Mode to enable viewing in dark conditions. In this mode, all colors are converted to muted red tones so that you can view the favorite screens without reducing your night vision. You may enter Night Mode by pressing the “Night Mode” button in the Commands & Settings Dialog. In Night Mode, this button changes to read “Day Mode”, which you may press to exit Night Mode and return to Day Mode.
You may also press “Alt” and the “N” key to toggle between day and night modes, or create an Active Button to toggle the mode.
9.3.4 Switching Between Windowed and Full-Screen Configurations
You may change the viewing mode of N2KView to take up the entire computer screen. Pressing the “F11” key will toggle N2KView between full-screen mode and windowed mode. In full-screen mode, you may wish to hide the Windows taskbar so that the N2KView window is the only visible element on the computer screen. You can do this by right-clicking on the Windows taskbar, selecting ‘Properties” from the pop-up menu, checking the “Auto-hide the taskbar” box on the “Taskbar” tab of the “Taskbar and Start Menu Properties” dialog box that displays, then clicking on the “OK” button. The Windows taskbar will then disappear from view but will reappear whenever you move the mouse to the bottom edge of the computer screen.
You may also enter Full Screen mode by pressing the “Enter Full Screen” button in the Commands & Settings Dialog. In Full Screen Mode, this button changes to “Exit Full Screen”, and now can be used to exit Full Screen mode.
Escape (ESC) will also transition from Full Screen Mode to Windowed Mode.
If the system was shut down in Full Screen mode, then it will start up again in Full Screen mode after the initial Warning message has been accepted.
The MBB300C and TSM810C will only operate in Full Screen Mode and have no ability to change out of this mode.
9.3.5 Minimizing N2KView
To minimize N2KView to the taskbar, switch N2KView into windowed mode if it not already there (see Section 9.3.4 for details), and then click on the minimize button (with a straight horizontal line in the bottom of the button), third from the right in the group of system buttons in the extreme upper right hand corner of the window, at the right edge of the Windows title bar.
N2KView running on the MBB300C and TSM810C may not be minimized.
9.3.6 Terminating N2KView
To terminate the N2KView program, click , on the Shutdown tab in the Commands & Settings Dialog.
If N2KView is in windowed mode, clicking on the “X” in the extreme upper right hand corner of the window, at the right edge of the Windows title bar, will also terminate N2KView.
You may also terminate N2KView using the “Alt-F4” or Ctrl-X key combination in full-screen mode, or in windowed mode when N2KView is the active window.
A confirmation pop-up will be displayed asking you to confirm the shutdown process. On the TSM810C and MBB300C you will also be given the option to shut down and restart the unit immediately.
9.4 Commands & Settings Dialog
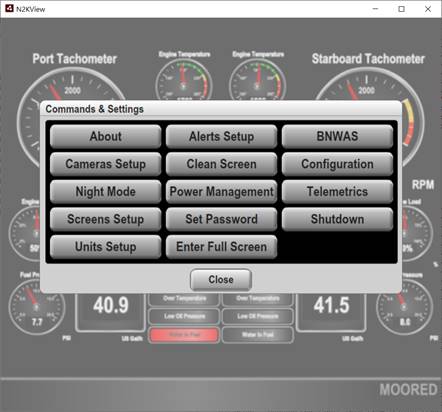
After you close the opening screen, the N2KView software enters normal operating mode. You may display the Commands & Settings Dialog at any time by pressing anywhere on the screen, and then clicking on the Commands & Settings tab on the right of the screen. The Commands & Settings Dialog appears in the center of the screen as shown below.
Figure 10 – N2KView Commands & Settings Dialog
If you are using an older licensing model and some modules have not been licensed, some buttons will grayed out. This indicated that these functions are not available.
This dialog may also vary slightly between the PC and MBB300C or TSM810C versions.
9.4.1 About Dialog
Pressing the “About” button will cause the “About” dialog to be displayed, which will display information about N2KView including
· The Software version number
· The label assigned to the unit by the user.
· The hardware license key number. For the MBB300C or TSM810C with direct NMEA 2000 connections, the Hardware License Key number is the serial number of the device.
· The name of the active configuration.
The Software Version Number and Hardware License Key number serial may be required in the event you need to contact Maretron for technical support.
Press the Close button to close the dialog box. A screenshot of the About Dialog is shown below.
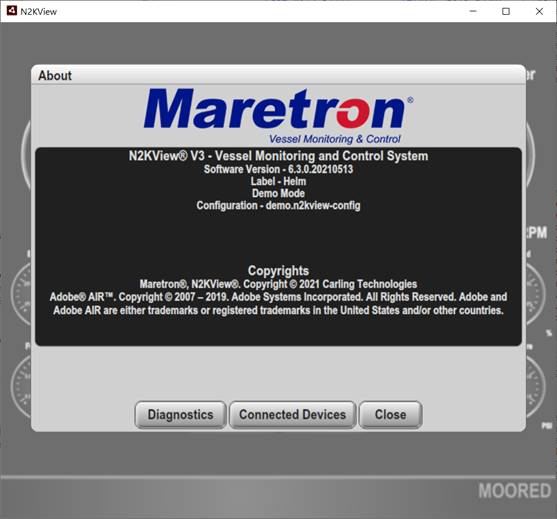
Figure 11 – About Dialog
The logo in the display may vary with different installations.
If connected to an IPG100 with an old license structure, the About dialog may also display the quantity of licenses installed on the IPG100.
The Diagnostics button will enable you to display extra diagnostic information should Maretron support request it. This is the same screen that is displayed when the F12 button on the keyboard is pressed. (e.g. to trace email connection problems in section 10.4.6.1.7). If requested to send a diagnostic log to Maretron to aid in troubleshooting, use this dialog, plug in a USB drive if on the MBB300C or TSM810C, and press the Capture button to save the log file to the USB Drive.
Pressing the Connected Devices button will show the Connected Devices dialog.
9.4.1.1 Connected Devices Dialog
This dialog gives you a list of devices connected to the NMEA 2000® bus with the raw PGN data from each device. The contents of the dialog are a snapshot of the latest data received at the time of opening the dialog. It is not dynamically updated, although the dialog may be refreshed at any time by pressing the Refresh button.
9.4.2 Alert Setup
Alerts are such an important part of N2KView that they have a section on their own in this manual. See section 10.
9.4.3 BNWAS
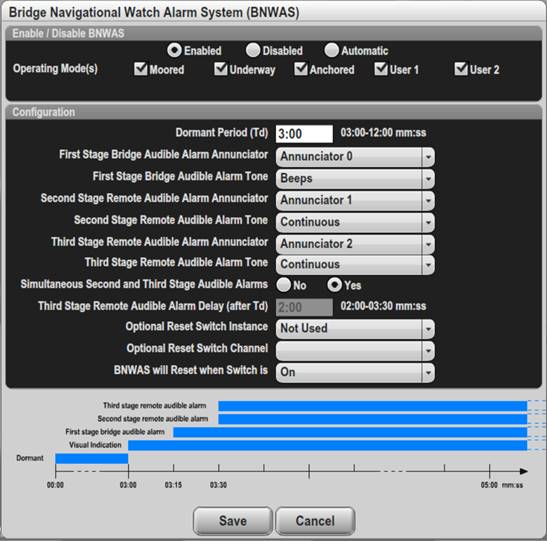
The Bridge Navigational Watch Alarm System (BNWAS) is described in section 11.
9.4.4 Cameras Setup
Setting up cameras is described in section 14.2.
9.4.5
Clean Screen
Figure 12 – Clean Screen Dialog
The Clean Screen Dialog disables all mouse and Touch Screen activity for 20 seconds so that a touch screen can be cleaned without triggering any undesired actions.
Pressing the Clean Screen button will disable all buttons and display a timer which counts down for 20 seconds.
When the timer reaches 0, the dialog is automatically closed.
9.4.6 Configuration Sub-Menu
Pressing the Configuration button in the Commands & Settings dialog displays the Configuration sub-menu.
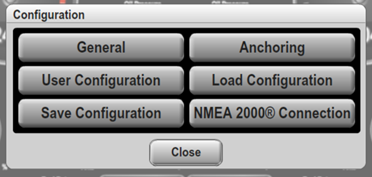
Figure 13 – Configuration Sub-Menu
All the manipulation of the user defined screens is done from this dialog. If you are running on a MBB300C or TSM810C, the NMEA 2000® Connection button is not displayed, and is replaced with an Ethernet button.
9.4.6.1 General Configuration Dialog
Pressing the “General” button causes the “General Configuration” dialog to be displayed. This window allows you to configure the parameters that are used in N2KView and if N2KView is running on the MBB300C or TSM810C it allows configuration of some system parameters.
A screenshot of the “General Configuration” dialog is shown below. Not all fields will be shown on each hardware platform.
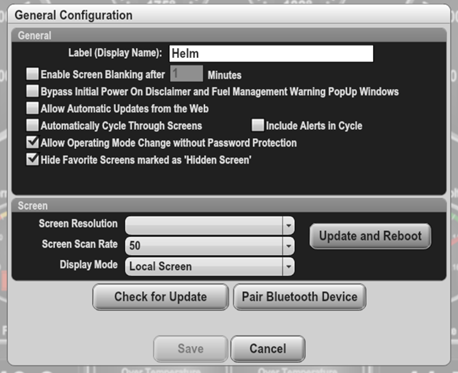
Figure 14 – General Configuration Dialog
9.4.6.1.1 Label (Display Name)
N2KView programs can be given a label so that an installation having multiple copies of N2KView can distinguish between them. This is important for the alert management, when the identity of the station that responds to an alert can be shown. The label is initially set by the user in the Initial Startup Warning dialog.
This is a text field into which the label of this copy of N2KView may be entered.
9.4.6.1.2 Enable Screen Blanking
This line is not visible on PC or Mac hardware platforms.
When selected, the screen will blank after the set amount of time. When unchecked, the screen will never blank. Touching the screen, or the generation of an alert will unblank the screen.
9.4.6.1.3 Bypass Initial Power On and Fuel Management Warning PopUp Windows
On startup, the normal operation is to display the disclaimer screen. If the computer is unattended and the power is cycled, N2KView will never get past this point and become operational. Checking this box will allow N2KView to bypass the Disclaimer Screen and start in normal mode without requiring operator input.
9.4.6.1.4 Allow Automatic Updates from Web
When checked (recommended) N2KView will query the Maretron website on each startup to see if a later version of N2KView is available. It also controls whether the Adobe Integrated Runtime (AIR) will check for and download updates automatically. This should be unchecked when data transfer rates are expensive, such as when using a satellite data link.
9.4.6.1.5 Automatically Cycle Through Screens
When checked N2KView will automatically cycle through the favorite screens, changing the display every 10 seconds. Screens that are not marked as favorite screens (i.e. not included in the drop down tabs) will be skipped. When any user interaction takes place, the cycling is paused for 2 minutes after the last user interaction so as to not interfere with the actions the user is taking.
9.4.6.1.6 Include Alerts in Cycle
When checked and the screens are cycling, the Alert Favorite Screen will be included in the cycle.
9.4.6.1.7 Allow Operating Mode Change without Password Protection
When the N2KView configuration is protected using a password, users will not be able to change the vessel operating mode without knowing the password. This may be too limiting, and can be overridden by checking this box.
9.4.6.1.8 Hide Favorite Screens marked as ‘Hidden Screen’
From version 5.0.15, it is possible to hide screens from users that do not have access to password. Using the Screen Editor dialog (9.4.9.2) mark each screen that should be hidden as a Hidden Screen, and then check this box.
To display these screens, only this box needs to be unchecked.
9.4.6.1.9 Screen Resolution
When this dialog is started on the MBB300C, N2KView queries the underlying operating system to determine what screen resolutions are available for the connected monitor. The resultant list of screen resolutions are displayed here and one may be selected by the user.
Changing the screen resolution requires that the box be rebooted with the new resolution. This is done by pressing the Update and Reboot button after selecting the new resolution.
9.4.6.1.10 Screen Scan Rate
This list allows the user to specify the required scan rate at which the monitor is to be configured. In most cases the highest scan rate can be set, but we have found one case where a specific lower value must be entered.
Changing the screen scan rate requires that the box be rebooted with the new scan rate. This is done by pressing the Update and Reboot button after selecting the new scan rate.
9.4.6.1.11 Display Mode
MBB300C only.
Changing the Display Mode to Remote HTML5 Access allows the N2KView Screen to be displayed on another display as a web page. The other display must be connected to the same Ethernet network as the MBB300C. This allows the MBB300C N2KView screen to be displayed, for example, on the Garmin 8400 series of MFDs. Having chosen to change the display mode, press the Update and Reboot button.
You may not simultaneously display on a screen connected to the MBB300C and a Remote HTML Screen.
9.4.6.1.12 Update and Reboot
Pressing this button will cause N2KView to exit, update the Screen Parameters on the computer, and then restart.
On restart, if the screen resolution was changed, the Disclaimer dialog will show a message requesting that the new screen resolution be accepted within 20 seconds. If this is not done, the box will be rebooted again with the old resolution / scan rate.
9.4.6.1.13 Check for Update
![]()
If connected to the Internet, N2KView will query the Maretron website and inform you if an Update is present. Normally this is checked on startup only, and then only if Allow Automatic Updates from the Web box is checked.
9.4.6.1.14 Calibrate Touch Screen (MBB300C)
![]()
The following Touch Screen Drivers have been pre-loaded onto the MBB300C.
· eGalax (USB)
These drivers have been tested on the NavPixel monitors
· Hampshire TSHARC (USB)
These drivers have been tested with the Hatteland HD Series monitors
· 3M Microtouch (USB & RS232)
These drivers have been tested with the Hatteland JH series monitors
These drivers have been tested with the Nauticomp Series II monitors
· ELO Intellitouch Drivers version 3.5.2 (USB)
· Penmount (RS232)
Touch Screen Drivers need to be calibrated to ensure that the position touches are accurately reported to the software. Pressing this button will cause N2KView to exit and start a separate program to calibrate the touch screen that you have connected. When the program is complete, N2KView will restart. In some cases the program can take a while (up to a minute) to start, so be patient.
Each driver has its own calibration program, and N2KView will examine the connected screen and choose the appropriate calibration program.
9.4.6.1.15 Save
The parameters in the General section of this dialog are stored in the configuration when the Save button is pressed. This button will be activated when any of these parameters are changed.
9.4.6.1.16 Cancel
Cancel allows you to exit the dialog without saving any of the parameters in the General section of the dialog.
9.4.6.2 User Configuration
If the same configuration is loaded on more than one terminal, each of these terminals will detect the same alert condition and generate an alert. This will result in multiple alerts being displayed on all the terminals for the same event. To prevent this, global alerts from this terminal may be disabled by the user by unchecking this box.
Local Alerts are not affected. Because they are not shared they will never result in duplicate alerts on one terminal.
This is typically used on a vessel with multiple displays to provide redundancy in alert generation. The full set of global alerts is loaded onto both displays, and then disabled on one display from this dialog. If the display with active global alerts was to be switched off, the only action needed to restore the alert monitoring capability will be to enable the alerts on the backup display.
To alert the user that no terminals are set to generate Global Alerts, the message “Global Alerts Disabled” will be displayed in the Alert Status bar (10.3.1).
This message will not be displayed if at least one terminal on the network has the “Enable Global Alerts from this Terminal” box checked.
9.4.6.2.1 Enable the Generation of Global Alerts from this Terminal
When unchecked, global alerts will not be generated from this terminal.
9.4.6.3 Load Configuration
Pressing the Load button brings up the Load Configuration dialog.
The Load Configuration Dialog is the way to change the currently running configuration. This can be helpful from shore station that is monitoring multiple vessels, or where different people on the same vessel prefer different screen layouts.
A screenshot of the Load Configuration dialog is shown below.
Figure 15 – Load Configuration dialog
There are three options to load a configuration.
9.4.6.3.1 Load the Default Configuration
9.4.6.3.2 Load Configuration from Disk
Pressing the Load Default button will load the default configuration as the new configuration. This will show a wide sample of available component types, and can be used as a reference for new designs.
Pressing the Get Configuration button in the this section will open a browser on the local computer. The user then finds the required configuration and selects the file. If the drive on which the configuration is stored is removable (e.g. a USB drive) then the configuration with all its background files will be copied onto the local disk of the computer so that it will be accessible after the removable disk is removed.
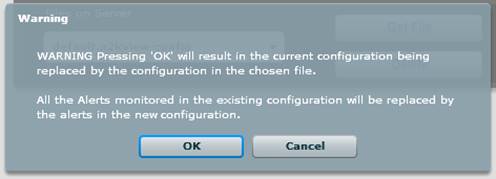
A warning dialog will be displayed, requiring the user to OK replacing the configuration.
9.4.6.3.2.1 PC or Mac
On a PC or Mac, the standard browser is opened.
9.4.6.3.2.2 TSM or MBB
On the TSM800C, TSM810C, TSM1330C, MBB300C pressing the Get Configuration button brings up the following Load Configuration dialog.
A screenshot of the Load Configuration dialog is shown below.
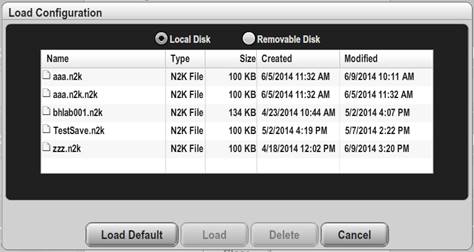
Figure 16 –TSM/MBB Load Configuration Dialog
9.4.6.3.2.2.1 Local Disk / Removable Disk
These radio buttons will only be displayed if a USB drive is plugged into the computer; they allow the selection of the local disk or the USB drive as the source of the configuration to be loaded.
9.4.6.3.2.2.2 Load Default
Pressing this button will load the factory supplied default configuration. This is a useful starting point for designing your own screen or exploring different options within N2KView.
9.4.6.3.2.2.3 Load
This button is activated when configuration is selected in the table. Pressing the button will load the configuration. If the configuration is being loaded from a USB drive, it will be copied from the USB drive to the Local Disk, with all its associated background files, before being loaded.
9.4.6.3.2.2.4 Delete
This button is activated when a configuration is selected in the table. Pressing the button will delete the configuration from the disk
9.4.6.3.2.2.5 Cancel
Pressing this button will exit out of the dialog without loading a new configuration.
9.4.6.3.3 Load Configuration from IPG100
The Load Configuration from IPG100 section of the dialog will only be displayed if an IPG100 is detected on the same Ethernet network, or the PC is connected to an IPG100 through the Real Time Cloud Services.
The IPG100 has the capability of storing configuration files on behalf of N2KView. When the dialog opens, the detected IPG100s will be entered in the list under Devices; scroll down and select the IPG100 from which the configuration will be loaded. The list of configurations currently stored on that IPG100 will be will be used to populate the entries of the Configurations on IPG100 list. When the configuration to be loaded is selected, the Get Configuration and Delete Configuration buttons are enabled. If a configuration of the same already exists on the device on which the user is working (this device), a warning is displayed.
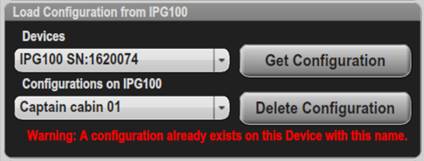
Press the Get Configuration button to transfer the file to this N2KView client.
If the configuration was saved to the IPG100 with the background images (available from version 3.6.0), the configuration will be retrieved from the server with the background images and saved together. The download progress of each file will be reported.
When all the background images and the configuration file have been transferred, a warning dialog will be displayed, requiring the user to OK replacing the configuration.
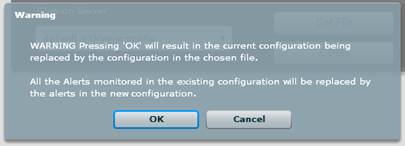
Press the Delete Configuration button to delete a configuration from the IPG100. If background images were saved with the configuration, they will be deleted as well.
9.4.6.3.4 Load Configuration from another N2KView
The Load Configuration from another N2KView section of the dialog will only be displayed if another copy of N2KView running at least version 6.0.14 is detected on the same Ethernet network.
This feature allows direct transfer of configurations between PCs, TSM810Cs, and MBB300Cs.
When this dialog opens, the detected copies of N2KView will be entered in the list under Devices; scroll down and select the device from which the configuration will be loaded. The list of configurations currently stored on that device will be will be used to populate the entries of the Configurations on Device list. When the configuration to be loaded is selected, the Get Configuration button is enabled. If a configuration of the same already exists on the device on which the user is working (this device), a warning is displayed.
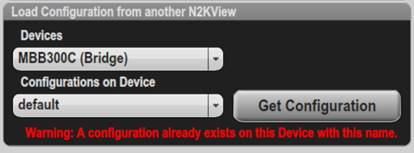
Press the Get Configuration button to transfer the file to this N2KView client.
When all the background images and the configuration file have been transferred, a warning dialog will be displayed, requiring the user to OK replacing the configuration.

9.4.6.4 Save Configuration
Pressing the Save button brings up the Save Configuration dialog. This is the way to save the current configuration, either to the local file system, or to an IPG100. A screenshot of the Save Configuration Dialog is shown below.
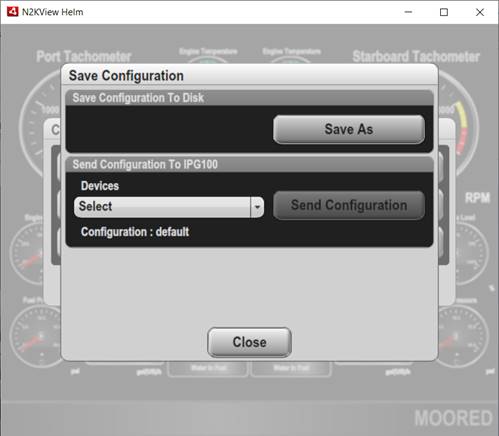
Figure 17 – Save Configuration Dialog
There are two options to save the current configuration.
9.4.6.4.1 Save Configuration to Disk
9.4.6.4.1.1 On PC or Mac
Pressing the Save As button will open a browser on the local file system, and prompt the user to Enter a New Configuration name.
9.4.6.4.1.2 On a TSM810C or MBB300C
Pressing the Save button on a TSM810C or MBB300C brings up this Save Configuration dialog. This is the way to save the current configuration, either to the local file system, or to a USB Drive. A screenshot of the Save Configuration dialog is shown below.
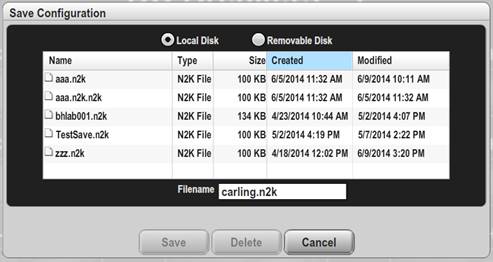
Figure 18 – TSM/MBB Save Configuration Dialog
9.4.6.4.1.2.1 Local Disk / Removable Disk
These radio buttons will only be displayed if a USB drive is plugged into the computer; they allow the selection of the local disk or the USB drive as the source of the configuration to be loaded.
9.4.6.4.1.2.2 Save
This button is activated when configuration is selected in the table. Pressing the button will save the configuration on the selected drive. If the configuration is being saved to a USB drive, it will be copied to the USB drive with all its associated background files.
9.4.6.4.1.2.3 Delete
This button is activated when a configuration is selected in the table. Pressing the button will delete the configuration from the disk.
9.4.6.4.1.2.4 Cancel
Pressing this button will exit out of the dialog without saving the configuration.
9.4.6.4.2 Send Configuration (to IPG100)
The Send Configuration to IPG100 section of the dialog will only be displayed if an IPG100 is detected on the same Ethernet network, or the PC is connected to an IPG100 through the Real Time Cloud Services.
When sending to the IPG100, the current configuration will be sent. The name of the configuration is shown under the list of devices.
When the dialog opens, the detected copies of N2KView will be entered in the list under Devices; scroll down and select the IPG100 to which the configuration will be sent. When the IPG100 is selected, the Send Configuration button is enabled.

Pressing the Send Configuration button will send the configuration to the IPG100 where it will be saved with the associated filename.
From version 3.6.0, if the configuration contains background images, the background images will be transferred to the IPG100 with the configuration. If these images are large, the transfer will take longer. The progress of each file’s transfer will be reported on a progress bar.
9.4.6.5 Ethernet Dialog
This dialog is only present on the TSM810C and MBB300C and controls the configuration of the Ethernet network connection.
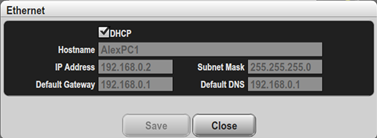
Figure 19 – Ethernet Dialog
9.4.6.5.1 DHCP
DHCP (Dynamic Host Configuration Protocol) is a method by which the computer can get its IP address (see section 8.2) assigned on startup by a router on the network. The router must be capable of assigning IP addresses using DHCP for this to work.
If there is no router, or the network administrator chooses to allocate all the addresses, then this box should be unchecked, and the IP address chosen for this device entered in the IP Address field.
9.4.6.5.2 Hostname
This is the name by which this MBB300C or TSM810C will be known on the network. This field is set from the Label (Display Name) entered at startup, and may not be edited here.
9.4.6.5.3 IP Address
This field is disabled if the use DHCP box is checked.
This is the IP Address for this MBB300C or TSM810C.
9.4.6.5.4 Netmask
This is a mask used to divide an IP Address into subnets. Basically it tells the computer how much of the IP Address defined the network, and how much may be used by computers on the network. For most networks the first three parts of the IP Address define the network (i.e. every computer on the network must have the same values) and the last part defines the computer (i.e. every computer on the network must have a different value). Where the value 255 appears in the Netmask, the values define the network and must be the same.
The most common value is 255.255.255.0.
9.4.6.5.5 Default Gateway
This must be set to the IP Address of the router.
9.4.6.5.6 Default DNS
This is the IP address of a router or a computer on the Internet that can identify and locate computer systems and resources on the internet. If the Router cannot provide this service, you may enter a value of 8.8.8.8 which is the Google DNS Server.
9.4.6.6 NMEA 2000® Connection
The fields in this section are used to control the connection to NMEA 2000® Bus.
The TSM810C and MBB300C connect directly to the NMEA 2000® Bus, and do not have this button.
A screenshot of the “NMEA 2000® Connection” dialog is shown below.
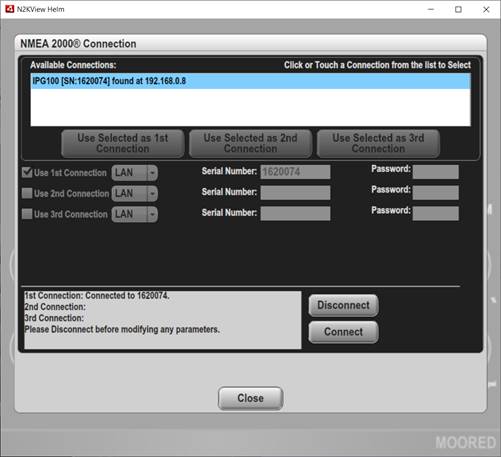
Figure 20 – Connections Settings Dialog
The connection settings dialog can be configured with alternative connections to the NMEA 2000 Bus. Whenever the Connect button is pressed, it will try to use the 1st Connection; if this fails it tries the 2nd Connection, and then the 3rd. This sequence is repeated until a connection is made. Having the Use xxx Connection box unchecked will cause this option to be skipped. Once a connection is made, it is held and the other options are not tried.
For example, on a laptop, you may configure the 1st Connection with the Serial Number of the IPG100, and configure the 2nd Connection to use the Maretron Cloud Server. That way N2KView will attempt the local connection first; if you are off the boat the local connection will fail and you will fall back to the Cloud Server.
Or, if you have a primary IPG100 and backup USB100 with a PC server on your network, enter the Serial Number of the IPG100 as the 1st Connection and the USB100 as the 2nd Connection; if the primary fails, you will automatically fall back to the backup.
9.4.6.6.1 Available Connections
If N2KView detects any IPG100s on the local network (LAN) or that a USB100 is connected, it will populate this list with a list of the IPG100s and USB100s found. It gives the serial number and IP Address of the IPG100 and the number of the Dongle plugged into the computer connected to the USB100. The connection may be entered into one of the three main Connections by selecting the line in the list and pressing one of the buttons directly below the list.
9.4.6.6.2 Use 1st Connection
Having this box checked enables the rest of the boxes for the 1st Connection, and is an overall enable for the 1st Connection.
9.4.6.6.3 Use 2nd Connection
Having this box checked enables the rest of the boxes for the 2nd Connection, and is an overall enable for the 2nd Connection.
9.4.6.6.4 Use 3rd Connection
Having this box checked enables the rest of the boxes for the 3rd Connection, and is an overall enable for the 3rd Connection.
9.4.6.6.5 Connection Type
![]() This
is a drop down list from which you may select one of the following connection
types for the connection to the NMEA 2000 network.
This
is a drop down list from which you may select one of the following connection
types for the connection to the NMEA 2000 network.
· USB – This is only displayed if a USB100 is available. You will connect through a USB100 connected to the same PC. No other parameters are required. It is not possible to connect to a USB100 from a Mac.
· LAN – You will connect through an IPG100 connected to the same network as the computer. The IPG100 will be identified by its serial number, and N2KView will find it on the network even if its IP Address changes.
![]()
The serial number of the IPG100 and the N2KServer Password (from the IPG100) must be entered.
· WAN – You will connect through an IPG100 connected on the same network, or on another network through Internet gateways and bridges. The IPG100 will be identified by its IP Address, or the address of a Port on a gateway that will forward messages to the IPG100. This is the most complex type of connection to set up an generally requires the services of an Internet Technician.
![]()
The IP Address (or Hostname) and port number on the gateway, and the N2KServer Password (from the IPG100) must be entered.
· Cloud – You will connect through the Maretron Cloud Server on the Internet. Both the computer and IPG100 must have internet access. The IPG100 will identify itself to the Maretron Cloud Server through the serial number of the Dongle plugged into the IPG100, or (if it does not have a Dongle) the Serial Number of the IPG100 itself.
![]()
The Cloud Username and N2KServer Password (from the IPG100) must be entered.
9.4.6.6.6 IP Address / Hostname (WAN only)
Please set this field to the Hostname or IP address of the IPG100 to which you wish to connect.
9.4.6.6.7 Port (WAN only)
Please leave this field at the default setting of 6544, unless you have a router between N2KView and N2KServer set up with Port translation.
9.4.6.6.8 Serial Number (LAN only)
This is the serial number of the IPG100 to which you want to connect. The easiest way to populate this field is by selecting the IPG100 in the list of Available Connections and pressing one of the Use Selected as … Connection buttons.
9.4.6.6.9 Password (WAN, LAN, and Cloud)
Please set this field to the same value as you entered in the “Server Password” text box of the IPG100 to which you are connecting. NOTE: this is different from the configuration protection password which is changed using the “Password” tab.
9.4.6.6.10 Cloud Username (Cloud only)
This is the username under which the Cloud Services agreement was signed.
9.4.6.6.11 Optional Software License(s) to Check Out
When connecting to a server with older license types, and a selection of optional additional modules, a list of optional software licenses to check out will be displayed. These licenses for these modules are stored in the key attached to the IPG100 and must be checked out to enable their functionality. If you require the use of this functionality in this copy of N2KView, then check the corresponding box. Not checking the box may enable other users access to those features.

These boxes may only be changed when we are disconnected.
If a license is requested and not available, the box will be overlaid with a red “X”.
9.4.6.6.12 Cloud Server Usage
When connected to the cloud server, the following information is displayed to show how many Gigabytes have been used by the cloud server connection in the current cycle and how many Gigabytes are left. The date at which the usage will be reset is also shown.

9.4.6.6.13 Disconnect
Press this button to disconnect from the server, and to return the license previously granted to the pool of available licenses.
9.4.6.6.14 Connect
Press this button to connect to the NMEA 2000 bus through an USB100 or IPG100. To make a successful connection and get live data flowing from the NMEA 2000 Bus to N2KView will require a license. Licenses are stored on the Hardware License Key (or Dongle).
If the key is plugged into the PC running N2KView, then this is the license that N2KView use. Otherwise N2KView will request a license from the IPG100, and the key must be plugged into the IPG100. It is not possible to request a license from a key plugged into a Mac.
The success (or failure) of the connection attempt will be displayed in the “Connection State” area of the dialog.
9.4.6.6.15 Connection State
This is the area on the dialog (at the bottom left) which communicates the current state of the connection to the server. For demo versions of N2KView, this field will show “Demo Mode”.
9.4.7 Night Mode
Pressing the “Night Mode” button places a red filter over the screen for night use. When in Night Mode, the text on the button changes to “Day Mode”, and pressing the button will remove the red filter.
Pressing Alt-N on the keyboard will also toggle between night and day modes, or an Active button can be created to execute the mode change.
9.4.8 Power Management Sub-Menu
Pressing the Power Management button in the Commands & Settings dialog displays the Power Management sub-menu.
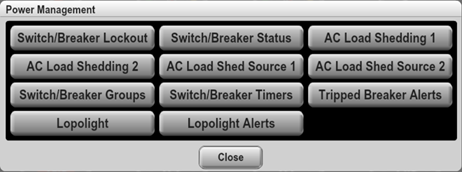
The Power Management functions of N2KView are designed to work with the Carling® OctoPlex® AC and OctoPlex® DC breakers, the MPower DC Load Controllers (CLMD12 and CLMD16), and the Maretron DC Relay module (DCR100).
In version 6.3.0 an interface to a Lopolight controller was added. Note that this requires an Ethernet connection to the Lopolight Controller, and does not communicate over the NMEA 2000 bus.
9.4.8.1 Switch / Breaker Lockout
From N2KView version 3.4, N2KView supports LOCKing of breakers. This provides a method of preventing automated or accidental switching of breakers. When working on a circuit that may be switched, users should always LOCK that circuit in the OFF state to prevent shocks. Circuits that are required for boat safety (such as bilge pumps) may be locked in the ON state to prevent accidental de-activation.
Breaker Lockout requires the optional Control Module to be licensed. (this is included in version 4 licenses)
The LOCK status is stored in the switch, therefore when one copy of N2KView locks a switch the status is reflected in other copies of N2KView and the DSM250. The switch must support locking for this feature to be used.
N2KView integrates with the locking features of the Carling® OctoPlex® range of AC and DC breakers, the Mareton MPower DC Load Controllers, and Maretron’s DCR100.
9.4.8.1.1 Displaying LOCKED Status

When a breaker is LOCKED, the on or off symbol on the switch is replaced with a padlock symbol.
9.4.8.1.2 Locking and Unlocking a Breaker
Pressing the Switch/Breaker Lockout button on the Power Management sub-menu opens the Breaker Lockout Dialog. If the Password has been set in N2KView, you will need to enter it before the dialog will be shown.
This provides a level of security so that breakers can be locked and the lock protected by a password. Whenever you are working on a circuit, Maretron advises you to LOCK the circuit OFF and set a password to protect yourself against someone else accidentally switching the circuit on.

Figure 21 – Breaker Lockout Dialog
On the left is the list of screens, and selecting a screen will display the contents of that screen on the right.
The switchable components in the screen that support locking may be selected by clicking with the mouse, at which point they are surrounded with a yellow border. Other components may not be selected. When a lockable component is selected, the Lock On, Lock Off and Unlock buttons at the bottom of the screen are enabled.

Once a breaker has been selected, it may be LOCKED or UNLOCKED by pressing one of the buttons at the bottom of the screen.
Pressing Lock On will UNLOCK the breaker, move it to the ON position, and then LOCK it again.
Pressing Lock Off will UNLOCK the breaker, move it to the OFF position, and then LOCK it again.
Pressing Unlock will UNLOCK the breaker, leaving it in its current state.
To exit the Breaker Lockout dialog, press the Close button at the bottom left.
9.4.8.2 Switch / Breaker Status
From N2KView version 5.0, N2KView supports the display of detailed status from Carling® OctoPlex® AC and DC breakers, and the MPower DC Load Controllers CLMD12 and CLMD16. Each of these have slightly different displays.
9.4.8.2.1 Displaying the Breaker Status
Pressing the Switch/Breaker Status button on the Power Management sub-menu opens either the AC Switch/Breaker Status Dialog or the DC Switch/Breaker Status dialog. The DC Switch/Breaker Status dialog is shown below.
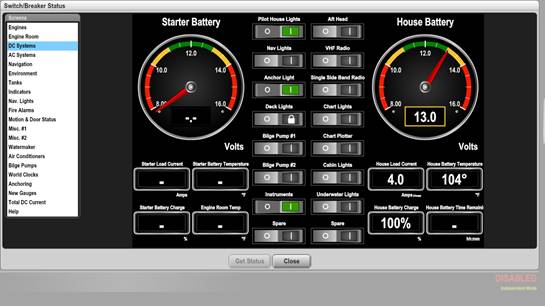
On the left is the list of screens, and selecting a screen will display the contents of that screen on the right.
The switchable components in the screen that support breaker status may be selected by clicking with the mouse, at which point they are surrounded with a yellow border. Other components may not be selected. When a suitable switch is selected, the Get Status button at the bottom of the screen is enabled.
On some components, the Breaker Status Dialog may be opened directly from the main screen, by doing
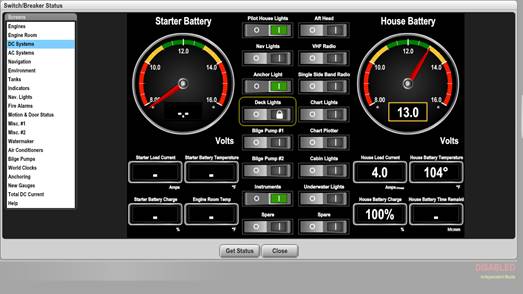
Having selected a breaker, the Detailed Switch/Breaker Status will be displayed, or can be displayed by pressing the Get Status button.
9.4.8.2.2 Octoplex DC Switch/Breaker Status Dialog
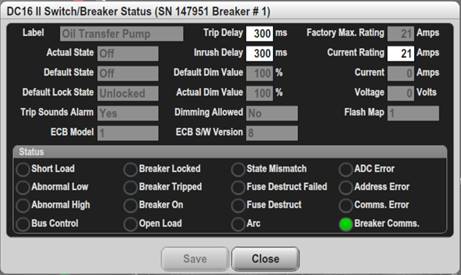
The Trip Delay, Inrush Current and Current Rating fields are editable. The new values are only sent to the Breaker when the Save button is pressed.
For details on the meaning of the fields, please refer to the Carling documentation.
9.4.8.2.3 Octoplex AC Switch/Breaker Status Dialog

No fields are editable.
For details on the meaning of the fields, please refer to the Carling documentation.
9.4.8.2.4 MPower CLMD12 Load Controller
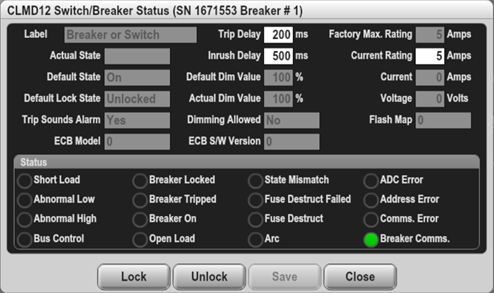
The Trip Delay, Inrush Current and Current Rating fields are editable. The new values are only sent to the Breaker when the Save button is pressed.
For details on the meaning of the fields, please refer to the CLMD12 documentation.
9.4.8.2.5 MPower CLMD16 Load Controller
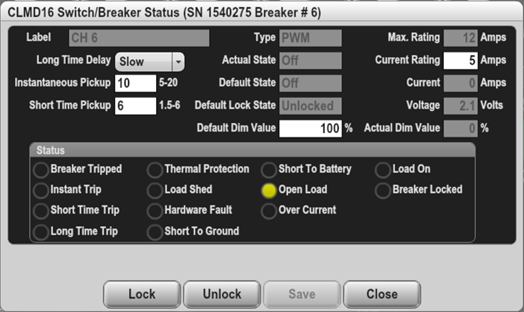
The Long Time Delay, Instantaneous Pickup, Short Time Pickup, Current Rating and Default Dim Value fields are editable. The new values are only sent to the Breaker when the Save button is pressed.
For details on the meaning of the fields, please refer to the CLMD16 documentation.
9.4.8.3 AC Load Shedding 1 and 2
N2KView can concurrently monitor 2 sets of AC sources and shed loads connected to those sources to ensure that the current drawn from the sources does not exceed a predetermined value.
This feature is described in section 12.
9.4.8.4 AC Load Shedding Source 1 and 2
This is an alternative way to change the source of the load shedding without a password. See section 12 for details.
9.4.8.5 Switch / Breaker Groups
From version 5.0, N2KView supports switching of multiple breakers from one control on the screen.
Each Switch Group consists of a set of switches, and each switch can be set go On or Off when the group is activated. A momentary push button control can then be created and placed on a user defined screen to place all the switches in the switches in the group into their predetermined state when the control is pressed.
Note that Switch/Breaker Groups are associated with an action and not the ongoing state of the switches in the group. i.e. separate groups are required to turn a set of switches On and Off.
9.4.8.5.1 Switch/Breaker Groups Dialog
Pressing the Switch/Breaker Groups button on the Power Management sub-menu will display the list of Switch/Breaker groups in the configuration.
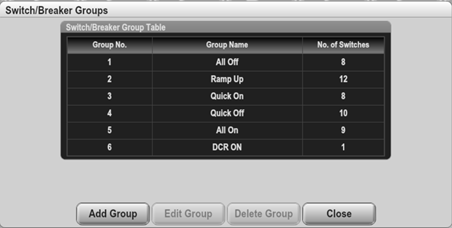
New groups are created using the Add Group button and existing groups edited by selecting the group in the table and pressing the Edit Group button. This will bring up the Switch/Breaker Group Editor.
9.4.8.5.2 Switch/Breaker Group Editor
In each group, the Switch/Breaker Group Editor shows the name of the group and which switches are controlled by the group.
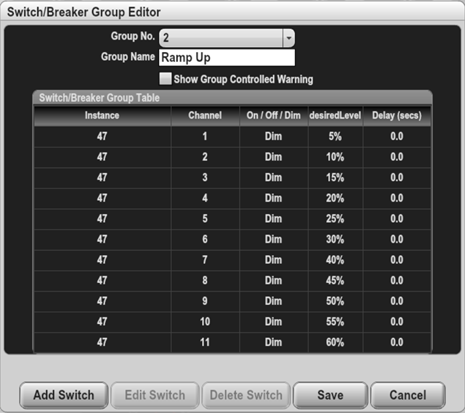
Group No. Each group is assigned a number
Group Name. The name is used to identify the group.
Show Group Controlled Warning. Normally when a switch displayed on a user defined screen is part of a Switch/Breaker Group, the switch is marked with the text “Group Controlled”. Unchecking this box will suppress the display of the warning.
9.4.8.5.3 Switch/Breaker Group Table.
This contains a list of the switches assigned to the group. Switches may be added by pressing the Add Switch button, or edited by selecting a switch/breaker in the table and pressing the Edit Switch button.
These actions displays the Switch/Breaker Editor.
9.4.8.5.4 Switch/Breaker Editor
The Switch/Breaker Editor allows editing of one entry in the Switch/Breaker Group, which identifies the breaker being controlled and the desired state of that breaker.
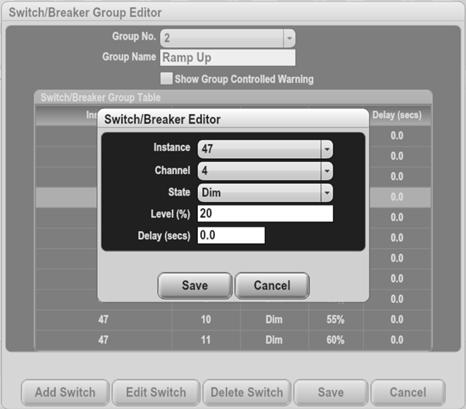
Instance defines the instance number of the switch being controlled
Channel defines the channel number of the switch being controlled
State defines the state to which the switch will be set when the group is activated. This state can be OFF, ON (100% brightness), or DIM (PWM).
Level (%) when the state is set to DIM, this specifies the required brightness level
Delay (secs) allows the action taken when the group is activated to be delayed by a fixed amount of time. If one action needs to take place before another, this parameter can be used to delay the second action in the group, or if a number of circuits are being turned ON, the turn on of the circuits may be staggered to avoid all the inrush currents overloading a breaker at the same time.
9.4.8.6 Lopolight
N2KView is integrated with the Lopolight Navigation Light Controller (NLC) replacing the need for the Lopolight Mimic panel on vessels with limited space. As the NLC does not have an NMEA 2000 interface, the connection is made through Ethernet. N2KView allows monitoring and control of the lights, and will convert any alarms into alerts on the NMEA 2000 bus.
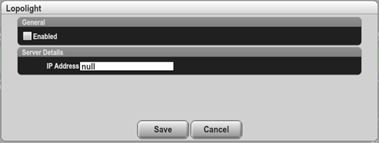
Enabled – this box must be checked for N2KView to make a connection to the NLC.
IP Address – the IP Address of the Lopolight NLC on the same Ethernet network as N2KView’s host.
9.4.8.7 Lopolight Alert
This is an alert template that will be used when an alarm condition is reported by the NLC to convert the alarm into an NMEA 2000 alert.
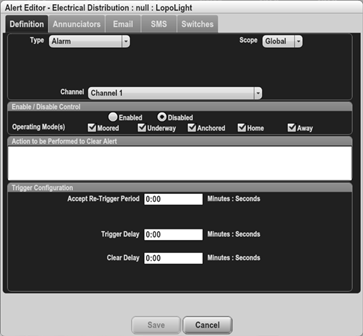
Refer to the Alert section 10.4.4 for more details on this dialog. The Priority, Description and Location fields will be filled in appropriately by N2KView when an alarm from the NLC is received.
9.4.9 Screens Setup
When your start N2KView for the first time, you will notice that there are predefined favorite screens already set up for you. You can use these favorite screens as they are provided, modify them to suit your needs, or delete them and create your own favorite screens.
9.4.9.1 Screens Setup Screen
Pressing “Ctrl” and “S” is a shortcut to display the Screens Setup Screen.
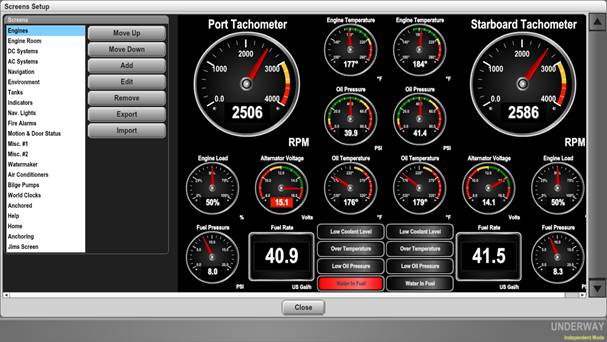
Figure 22 – Screens Setup Screen
Note that this screen has a Close button. If any changes are made that are not immediately executed, the Close button will be replaced by Save and Cancel buttons. The changes will only take effect when the Save button is pressed.
9.4.9.1.1 Screens
The list of user-defined screens is on the left of the “Screens Setup” dialog. This list contains the names of all your user-defined screens. In order to select a particular screen, select its name in the “Screen List” by pressing on it. It will then be highlighted in the list.
9.4.9.1.2 Changing the Order of the Screens
The order of the favorite screens in the drop down tabs is determined by their order in the Screens list. After selecting a screen use the Move Screen Up and Move Screen Down buttons to move the selected screen up or down in the list to set the desired order.
9.4.9.1.3 Adding Screens
In order to create a new screen, press the Add button. This will bring up the Add New Screen dialog, in which you can define the height and width of the new screen and give it a title.
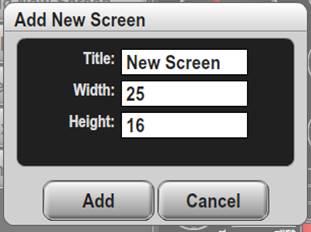
The default height of the a new screen is always set at 16 squares. The default width is calculated by looking at the aspect ratio of your screen (if in full screen mode) or the window (if not in full screen mode) so that the final result will maximize the use of the space available for controls.
When the Add button is pressed, the Screen Editor dialog will be displayed with no controls. (see section 9.4.9.2)
9.4.9.1.4 Editing Screens
In edit an existing screen in your configuration, select its name in the “Screens” list, and then press the “Edit” button. This will display the Screen Editor dialog (see section 9.4.9.2). Pressing Ctrl-E while on the main screen is a shortcut to open the Screen Edit Dialog directly from the main screen.
9.4.9.1.5 Removing Screens
In order to remove a favorite screen from your configuration, select its name in the “Screens” list, and then press the Remove button. This action will only be completed when the Save button is pressed.
9.4.9.1.6 Exporting Screens
The layout of the currently selected screen may be exported to disk as an N2KView Favorite Screen File. Pressing Export will open a browse dialog that will enable you to select a filename for the screen. The extension of the .nvs will be appended to the filename.
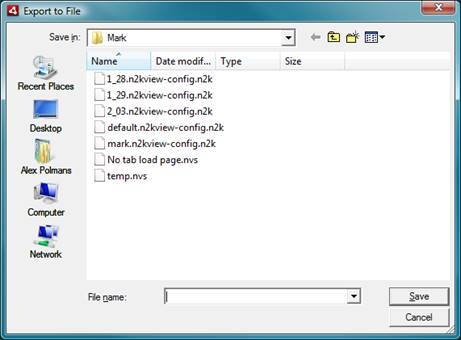
Selecting an existing file will cause that file to be over-written, otherwise the file is created.
9.4.9.1.7 Importing Screens
Favorite Screens may be imported from disk. Pressing Import will open a browse dialog that will allow you to select an N2KView User-defined Screen (.nvs) file.
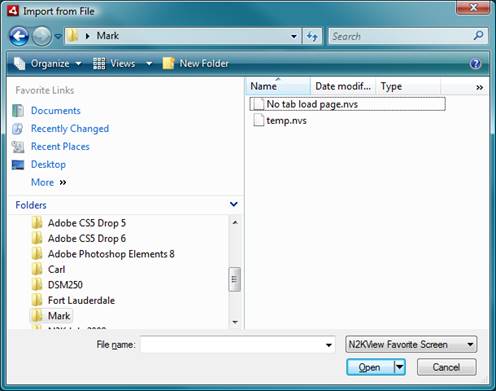
If the file exists, the imported screen will be added to the Screen List.
9.4.9.2 Screen Editor Dialog
The Screen Editor dialog is where the contents of individual screens are edited.
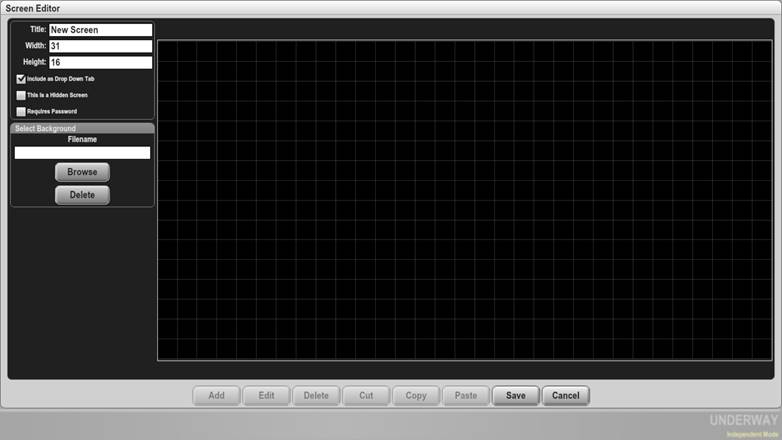
In this dialog, the screen is overlaid with two constructs to aid the user. The first is a grid of squares to which the components will be snapped as they are placed on the screen. The second is the white border box which shows the optimum aspect ratio of the screen based on the aspect ratio of the physical screen. If the default values from the Add Screen dialog (section 9.4.9.1.3) are used, the white border will be paced on the edge of the grid.
9.4.9.2.1 Renaming Screens
In order to change the name of a screen, edit the Title in this dialog. The change will take place immediately in this dialog and be transferred to the main screen when the Save button is pressed.
9.4.9.2.2 Resizing Screens
In order to change the size of a screen, change its Width or Height in this dialog. The change will take place immediately in this dialog and be transferred to the main screen when the Save button is pressed. You will need to click outside this field for the change to take place.
If you changed the favorite screen to have more squares than it previously had, all of the existing components will appear in the upper left corner of the new favorite screen. If you change the favorite screen to have fewer grids than it previously had, then all of the components that would fall off the lower and/or right edges of the favorite screen with the newly defined size, will be removed from the favorite screen configuration.
9.4.9.2.3 Removing Screens from the Drop Down Tabs
By default, all screens are Favorite screens, i.e. they may be displayed by dropping down the tabs and clicking on the tab for that screen. Screens may be removed from the set of tabs by unchecking the Include as Drop down Tab box. To access these screens, either the box must be checked again, or an Active Button (see 9.5.1 and 9.5.2) must be created on another screen to display this screen.
9.4.9.2.4 Hiding screens from general use
Screens may be marked as having the potential of being hidden (i.e. they will not be displayed in the tabs, and will be skipped when navigating using the arrow keys or screen selection buttons).
Mark the screen by checking the This is a Hidden Screen box. To actually hide the screens, the checkbox Hide Favorite Screens marked as ‘Hidden Screen’ in the General Configuration dialog (9.4.6.1.8) must also be checked.
9.4.9.2.5 Setting a Background Image
An image file ( *.jpg, *.png, *.gif, *.swf) may be displayed behind the controls, either just for fun or give context to the components. There is a restriction on swf files that the internal content of the swf file must be a bitmap. The example below shows a Favorite Screen where components that show the status of the Navigation Lights have been placed on an image of the yacht. Either type in a filename directly or use the Browse button to locate the image.
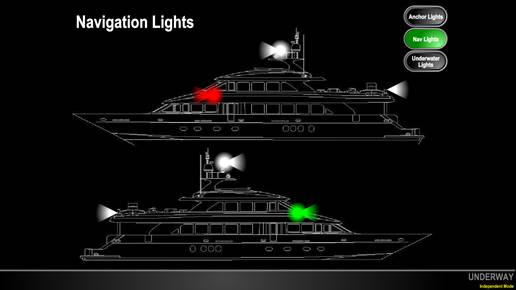
9.4.9.2.6 Passwords
Individual screens may be protected by a password. If this box is checked, users will be required to enter a password to view the screen.
9.4.9.2.7 Deleting a Background Image
Pressing the Delete button will delete the image.
9.4.9.2.8 Adding an Component to a User Defined Screen
To add a component to a screen, start by defining the space where the component will be placed. Move the mouse cursor to the top-left square where the component will be placed, press the mouse button and then move the cursor to the bottom right corner of the area. As you do that, a light gray area will be drawn on the screen to define the area where the component will be placed. You may not add a new component which overlaps components that are already present, and the gray area will turn red. You can see the gray area over the USA in the following screenshot.
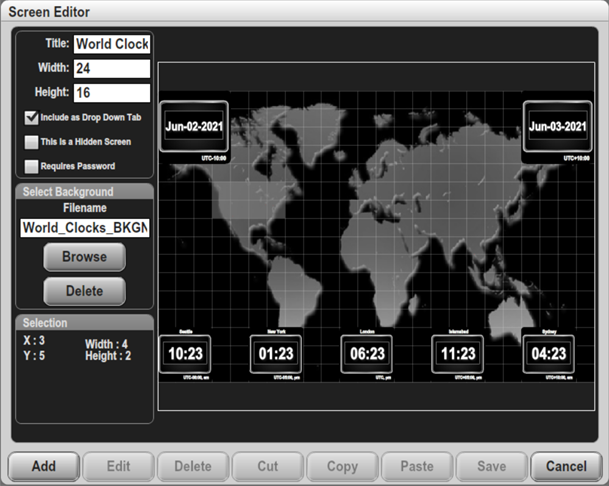
When an area has been selected, extra data is displayed on the left of the screen to describe the area.
· X and Y position of the top left of the selection
· Width and Height of the selection
Press the Add button at the bottom of the screen to display the List of Parameters, grouped by Categories, that can be displayed.
Clicking on a category (categories are displayed as folders) will open the category to display the parameters associated with that category. Note that some parameters may appear under more than one category.
An example screenshot of the “Parameter” list is shown below.
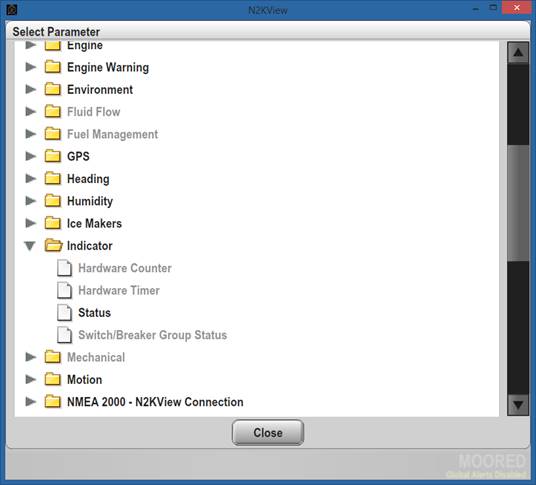
Figure 23 – Parameter List
Notice that some parameters are gray, while others are black. If you are connected to an NMEA 2000 bus, and there is at least one parameter of a type active on the bus, the parameter will be shown in black. This makes it easy to see what data can be displayed. You may select parameters that are gray or black.
Clicking on a parameter will open the Component Editor dialog for that parameter.
9.4.9.2.9 Changing Components on User Defined Screens
If you wish to change the data displayed by a particular component on the favorite screen, its title, its component type, or its defined data ranges, select the component on the favorite screen by pressing on it. When selected, a yellow border will be displayed around the component. Then press the Edit button at the bottom of screen.
A screenshot of a selected component is shown below.
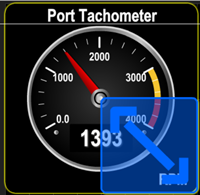
Figure 24 – Selected Component in Screens Setup Mode
When a component has been selected, extra data is displayed on the left of the screen to describe the selection.
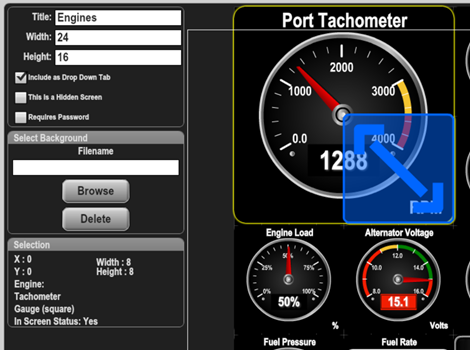
· X and Y position of the top left of the selection
· Width and Height of the selection
· Category - Engine
· Parameter Name - Tachometer
· Component Name – Gauge
· In Screen Status: this will be marked as Yes if the component will be included in evaluating the screen status in the current vessel operating mode. (see section 9.5.39)
Pressing the Edit button on the bottom of the screen will open the Component Editor with all the parameters of the component chosen.
9.4.9.2.10 Deleting Components from User Defined Screens
To remove a component from a particular favorite screen, select the component on the favorite screen by pressing on it. When selected, a yellow border will be displayed around the component. Then press the Delete button at the bottom of screen, or press the Delete button on the keyboard.
A dialog will be displayed asking you to confirm the delete action.
9.4.9.2.11 Cutting Components from User Defined Screens
To remove a component from a particular User Defined screen and place it on the N2KView Clipboard, select the component on the favorite screen by pressing on it. When selected, a yellow border will be displayed around the component. Then press the Cut button at the bottom of screen, or Ctrl-X on the keyboard.
No confirmation dialog is displayed, as this action may be undone by pasting the contents of the N2KView Clipboard back to the original position.
9.4.9.2.12 Copying Components from User Defined Screens
To copy a component from a particular favorite screen to the N2KView Clipboard, select the component on the favorite screen by pressing on it. When selected, a yellow border will be displayed around the component. Then press the Copy button at the bottom of screen, or Ctrl-C on the keyboard.
9.4.9.2.13 Pasting Components into User Defined Screens
If a component has been saved on the N2KView Clipboard, the Paste button will be enabled.
To paste the component, define an area on the screen as you would to create a new component, and then press the Paste button at the bottom of the screen, or Ctrl-V on the keyboard.
The component will be resized to fit the new area.
Pasting a component does not remove it from the N2KView Clipboard, so this action may be repeated.
9.4.9.2.14 Moving Components on User Defined screens
To change the location of a component on a particular favorite screen, select the component by pressing on it, then drag it to the new desired location and release the mouse button or remove your finger from the screen. You may not move a component to a location where it overlaps one or more other components. If you try to do this, the component will turn red, and on release of the mouse button will jump back to a legal position.
Key presses may also be used to move components. First select the component by clicking on it. Other components may be added to the selection by holding the Ctrl key and clicking other components. Ctrl-A will select all the components on the screen. Move the selected components by using the arrow keys on the keyboard.
9.4.9.2.15 Aligning Components on User Defined screens
Select the components on the screen by clicking on the component and adding more components using Ctrl-click. Press Alt-ß (keyboard left arrow) to align the left edge of components. Similarly Alt-à Alt-á and Alt-â will align the right, top or bottom edges.
9.4.9.2.16 Resizing Components on User Defined screens
To change the size of a component on a particular favorite screen, select the component by pressing on it, then press the blue double-headed arrow icon in the lower right-hand corner of the highlighted component and drag it until the component is the desired size, then release the mouse button or remove your finger from the screen. You may not resize a component so that it overlaps one or more other components. Since resizing only works on the lower right-hand corner of the component, you may want to move the component before resizing it so that the upper left-hand corner of the component is in the desired place before you resize it.
Key presses may also be used to resize components. First select the component by clicking on it. Other components may be added to the selection by holding the Ctrl key and clicking them. Ctrl-A will select all the components on the screen. Resize the selected components in place by using the + - keys on the keyboard, or the [ ] keys.
Pressing Alt at the same time as pressing any of the above keys will try to scale the components as a group. If it is not possible to position the components within the screen at the new scale without overlapping, the resizing will not take place.
9.4.9.3 Component Editor Dialog
The Component Editor has a number of different fields; only the fields that are applicable to the parameter chosen will be displayed.
Examples of Component Editors are shown below.
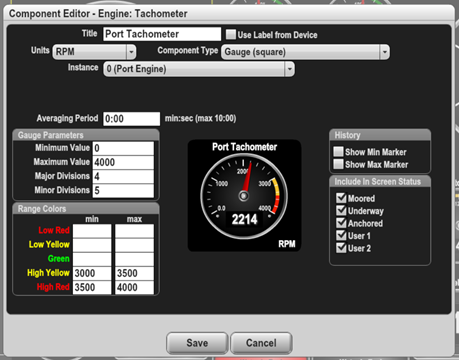
Figure 25 – Component Editor
9.4.9.3.1 Preview
Each component editor has a preview area in the center so that you can see what the finished component will look like. If real data matching the parameter is available, it will be displayed in the Preview.
9.4.9.3.2 Title

The title of the component is displayed to the left of Bar Graph Components, within Indicators, and above all the other types of Components. This is a free-form text field that should be used to clearly label what is being displayed. While there is no limit as to the length of the text that is entered, the resulting component may not show all the characters.
9.4.9.3.3 Use Label
Most Maretron devices are capable of being programmed to transmit a textual label to identify the parameter on the network. If the Use Label box is checked, then the component will display the received label instead of the title while the data is available. If the label or the data is not received by N2KView, the title will be displayed as entered in the Title field. During editing, the preview graphic will display the label if it is being received.
9.4.9.3.4 Component Type
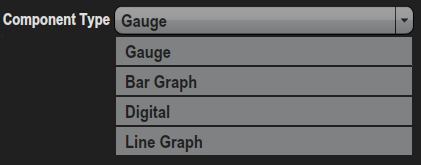
The Component Type drop-down list is a list of the component types available for the selected parameter. Depending on the parameter you selected, you will have choices of different component types to use to display the parameter. Select the desired component type by pressing on the down-pointing arrow to the right of the control, and then select the component type from the list. The preview will be updated with the component type selected.
In some cases, only a single Component Type will be available.
9.4.9.3.5 Units
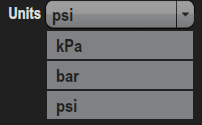
The Units drop-down list is a list of the units available for the selected parameter. Depending on the parameter you selected, you will have choices of different units to use to display the parameter. Select the desired unit by pressing on the down-pointing arrow to the right of the control, and then select the unit from the list. The preview will be updated with the unit selected.
In some cases, only a single Unit will be available.
9.4.9.3.6 Source
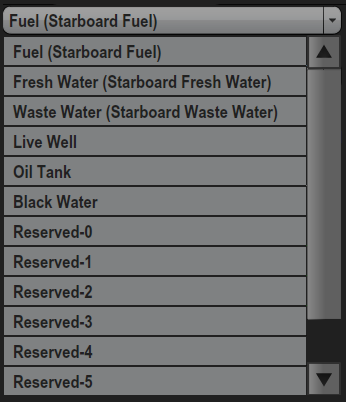
On parameters that have multiple sources, such as tanks, this field allows to select the source of the data. If label data is present on the bus for this parameter, it will be appended to the source name in parenthesis.
This field may not always be present.
9.4.9.3.7 Type
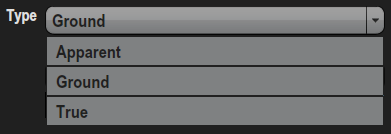
If the parameter supports multiple types, the Type field will be displayed. This is a drop down list containing the set of available data types for the parameter. Select the desired Type by pressing on the down-pointing arrow to the right of the control, and then select the type from the list. The preview will be updated with the Type selected.
9.4.9.3.8 Instance
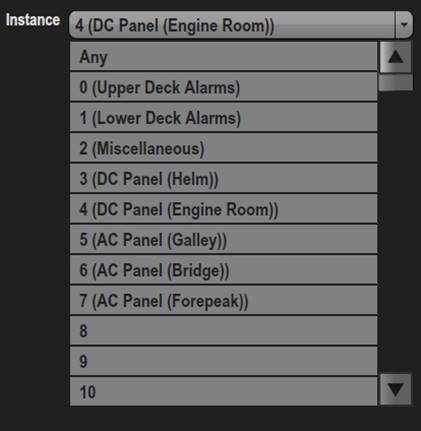
If more than one instance of the selected parameter can appear on the system, the Instance field will be displayed. If a label has been stored in the device, the label will be appended to the instance number in parentheses. This is a combo box limited by the number of available instances for the parameter. These could correspond to device instances or data instances. Select the desired Instance by pressing on the combo box and scrolling down to the required value. The preview will be updated with the Data Source selected. See section 8.3.1 for details on the “Any” option.
9.4.9.3.9 Instances

When creating a component that computes a value over more than instance of a value (e.g. the sum of the fuel levels in all the tanks), these are entered in a comma separated list of numbers. When complete, moving the cursor off the field will cause the preview to be updated.
9.4.9.3.10 Channel / Circuit Breaker
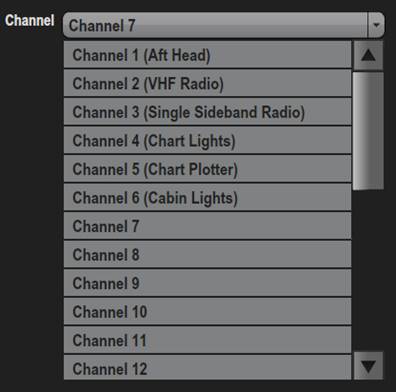
If the parameter you have selected has multiple indicators for each source (Electrical Distribution Circuit Breakers and Indicator Channels are examples of this), the Circuit Breaker or Channel field will be displayed. This is a drop down list containing the set of available indicators for the parameter. If a label has been entered for the indicator, the label will be appended to the indicator in parenthesis. Select the desired indicator by pressing on the down-pointing arrow to the right of the control, and then select the indicator from the list. The preview will be updated with the Channel or Circuit Breaker selected.
9.4.9.3.11 Minimum and Maximum Values

If you have selected a gauge component, a bar graph component, or a digital component with a parameter that has limits, the minimum and maximum values of that parameter should be entered here. In the case of the gauge component and the bar graph component, the minimum and maximum values are used to specify the limits on the gauge or bar graph. The minimum and maximum values are specified in the units displayed at the top of the page.
If the component you have selected is of the Rudder Angle type, then the required maximum value should be entered here.
If the component is displaying a percentage, then the limits will be fixed at 0 and 100.
9.4.9.3.12 Major and Minor Divisions
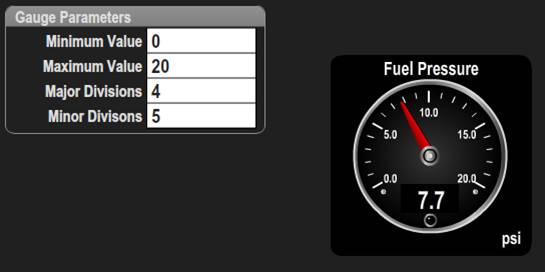
If the component you have selected is of the gauge type, then the required major and minor divisions should be entered here. Each major division is labeled with a value, and between the major divisions the minor divisions are smaller unlabeled tick marks.
In some cases, the value in the Major Divisions field will be fixed.
If the component you have selected is of the Rudder Angle type, then the required major divisions should be entered here. Each major division is labeled with a value.
Moving the cursor off the field will update the Preview.
9.4.9.3.13 Averaging Period
![]()
Any data stream may be averaged before being displayed. This is done using a moving average filter over the period specified. Entering a value of 0 seconds disables the filter.
Averaging data filters out short term fluctuations which can be distracting.
For angular values, an angular average is used. e.g. The average of 10º and 340º is 355º not 175º.
9.4.9.3.14 History
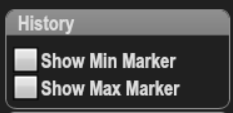
On some controls, extra “needles” have been added to show the extents of the needle movement. These are the min max marks. Typically they are blue for the minimum value, and red for the maximum value, but on controls where the min and max cannot be strictly applied, both are red, and there is only a single check box in the editor.
The Digital (1x1) component can also show these values as text.
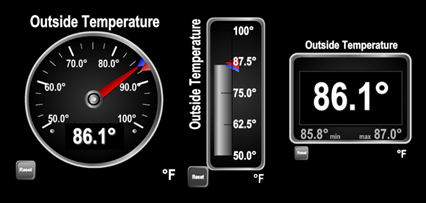
The marks may be brought back to the current needle position by pressing the Reset button located to the bottom left of the control.
9.4.9.3.15 Color Bands
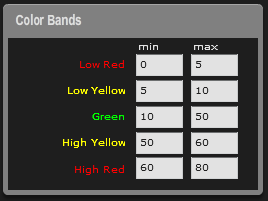
Gauges may have color bands drawn on them. Fields are provided for a low red range, a low yellow range, a green range, a high yellow range and a high red range. Both the minimum and maximum values for a range need to be filled for the range to be valid. If ranges overlap, red ranges will be drawn on top of yellow ranges and yellow ranges will be drawn on top of the green range. Gauges also have an LED below the digital part of the display, which will “light up” in the color of the appropriate range.
Digital displays will also show the color of the color band matching the value.
Bar Graphs can be colored in ranges as well. The portion of the bar that is displayed is colored to match the range data.
Example: If you are defining a gauge for battery voltage, you may decide that the gauge should display between 8 and 16 volts. You may also want the range between 11 and 13 volts to be considered normal, the range between 10 and 11 volts to be deserving of a low warning led, and any voltage below 10 volts to be deserving of a low fault indication. You may also wish the range between 13 and 14 volts to be deserving of a high warning led, and any voltage above 14 volts to be deserving of a high fault indication. In this case, you would set the values as shown in the screenshot below:
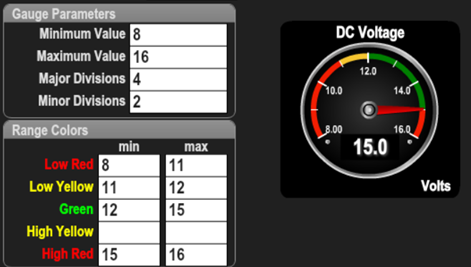
Figure 26 – Example of setting Divisions and Ranges
9.4.9.3.16 Indicator Colors
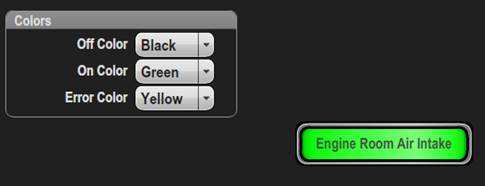
When the parameter type is an indicator, the Colors fields allow you to enter different colors for each of the states of the indicators. Select the desired color by pressing on the down-pointing arrow to the right of the control, and then select the color from the list.
9.4.9.3.17 Counter Options
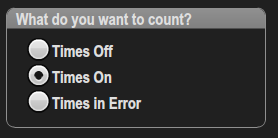
When the parameter type is an Indicator, Switch or Breaker, and the Component Type is a Digital Counter, or the parameter type is a Hardware Counter, the Counter Options fields allow you to specify which transitions you wish to count.
9.4.9.3.18 Timer Options
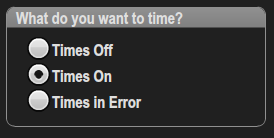
When the parameter type is an Indicator, Switch or Breaker, and the Component Type is a Timer, or the parameter type is a Hardware Timer, the Counter Options fields allow you to specify which states you wish to time.
9.4.9.3.19 Include in Screen Status
The Screen Status component (see section 9.5.39) gives a summary of the number of components on a screen that are in the red or yellow data ranges. This component is placed on a different screen so that a user can quickly get an indication of which screens have components that need attention.
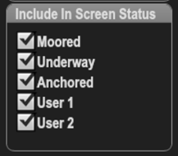
Normally, all the components on the screen are evaluated to determine this status. These checkboxes allow certain components to be excluded from the evaluation for each Vessel Operating mode. e.g. Engine oil pressure may in the red range if the pressure is less than 5 PSI, but when Moored the engine is not running and the low pressure should not be reported.
9.4.10 Set Password
Pressing “Ctrl” and “P” is a shortcut to display the Change Password Dialog.
N2KView allows you to set a password to protect your configuration from inadvertent changes. In order to set or change the password, press the “Set Password” tab, which will cause the “Set Password” dialog box to be displayed. If you are entering a new configuration password, leave the “Old Password” text box blank. If you are changing a configuration password, you must enter the existing password in the “Old Password” text box. Enter the new desired password into the “New Password” text box, and enter it again into the “Repeat New Password” text box. If you wish to remove the configuration password, simply leave the “New Password” and “Repeat New Password” text boxes blank.
If the Old Password is not correct, the New Password and Repeat New Password boxes will not be enabled.
The Save button will only be enabled when the New Password and Repeat New Password match.
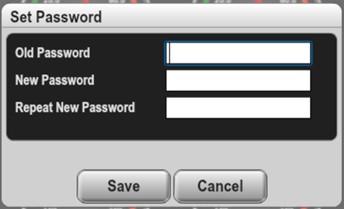
Figure 27 – Set Password Dialog
9.4.10.1 Enter Password Dialog
Trying to open a dialog that requires a password will now display the Enter Password dialog.
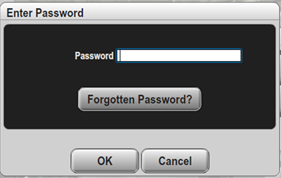
After entering the correct password, press OK to continue through to the dialog.
If you have forgotten the password, Maretron is able to help you recover it. Pressing the Forgotten Password? button will instruct you to make a copy of your Configuration and call Maretron support.
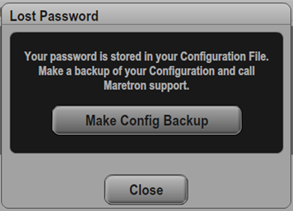
Pressing the Make Config Backup will assist you in making the backup and saving it to either a USB memory stick or your hard drive.
9.4.11 Shutdown
Pressing this button will close N2KView after prompting for confirmation.
Pressing “Ctrl” and “X” is a shortcut to display the dialog.
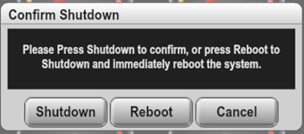
Pressing Shutdown will close any active files, such as graph data and exit N2KView, shutting down the MBB300C and TSM810C as well.
The Reboot button is only present on the MBB300C and TSM810C. It will perform a shutdown, and then request the operating system to reboot the hardware.
Cancel returns you to normal operation.
9.4.12 Units Setup
Pressing “Ctrl” and “U” is a shortcut to display the Units Setup Dialog.
Pressing the “Units Setup” button causes the “Units Setup” dialog to be displayed. The “Units Setup” dialog allows you to set the desired display units for the different parameter types supported by N2KView. The following sections provide more detail on the individual unit settings.
A screenshot of the “Units Setup” dialog is shown below.
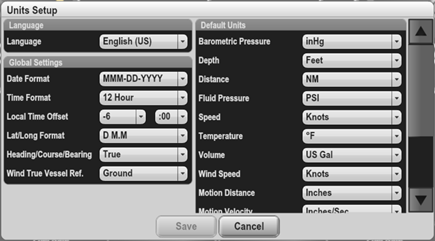
Figure 28 – Units Setup Dialog
9.4.12.1 Language
From version 3.2 of N2KView, multiple languages are supported. This is where you select the language in which you want program specific text to be displayed. Because you enter the title text, N2KView has no control over these values.
As soon as you select a language, all the displays will be changed to the language chosen. However, you still need to press the Save button to make this choice permanent. Pressing the Cancel button (that’s the button on the right) will cause the language to revert to what it was when you entered the dialog.
9.4.12.2 Global Settings
This section of the “Units Setup” dialog allows you to configure values that are used throughout the N2KView software.
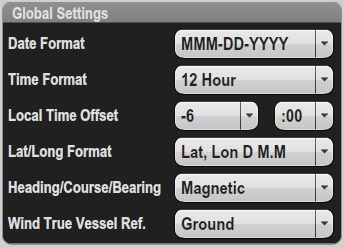
Global settings are applied to N2KView when the Save button is pressed. All formats are changed to reflect the chosen values.
9.4.12.2.1 Date Format
The format in which the date is presented can be chosen from one of the following options. Individual controls may choose to override this value.
· DD-MM-YYYY (e.g. 31-12-2007),
· DD/MM/YYYY (e.g. 31/12/2007),
· DD-MMM-YYYY (e.g. 31-DEC-2007),
· MM-DD-YYYY (e.g. 12-31-2007),
· MM/DD/YYYY (e.g. 12/31/2007),
· MMM-DD-YYYY (e.g. DEC-31-2007)
· YYYY-MM-DD (e.g. 2007-12-31)
· ISO8601 (e.g. 2007-12-31)
9.4.12.2.2 Time Format
The format in which the time is presented can be chosen from one of the following options. Individual controls may choose to override this value.
· 12 Hour
· 24 Hour
9.4.12.2.3 Local Time Offset
These selection boxes allow you to configure the offset from UTC (Universal Coordinated Time, also known as GMT, or Greenwich Mean Time). For example, if you were in the Eastern US, you would select -4:00 during daylight savings time, and -5:00 during standard time (daylight savings not in effect). You can configure local time in increments as small as 15 minutes.
Local Time Offset may be set to N2K, in which case N2KView will look for the offset on the NMEA 2000 bus (this value can be supplied in PGN 129033). If this value is not received on the bus then, as a last resort, N2KView will use the time offset defined in the computer. The value of the Local Time Offset can be displayed in a digital component using the Local Time Offset parameter under the Time/Date category.
9.4.12.2.4 Lat/Long Format
This selection box allows you to choose the default format in which Latitude and Longitude will be displayed.
· Lat, Lon D M.M – Unsigned Degrees and Minutes, showing minutes to three decimal places. Latitude will be followed by ‘N’ or ‘S’, Longitude will be followed by ‘E’ or ‘W’
· Lat, Lon D M S – Unsigned Degrees, Minutes and Seconds, showing seconds to one decimal place. Latitude will be followed by ‘N’ or ‘S’, Longitude will be followed by ‘E’ or ‘W’
· ±Lat, Lon Degrees – Signed degrees to five decimal places.
· Lat, Lon Degrees – Unsigned Degrees to five decimal places. Latitude will be followed by ‘N’ or ‘S’, Longitude will be followed by ‘E’ or ‘W’
9.4.12.2.5 Heading/Course/Bearing
This selection box allows you to decide whether headings, course, and bearing information are displayed as
· True (relative to the geographic North Pole)
· Magnetic (relative to the magnetic north pole).
To avoid confusion, it is not possible to display True and Magnetic bearings simultaneously.
9.4.12.2.6 Wind True Vessel Ref.
“Wind True Vessel Ref.” defines the reference used to calculate the True Speed and Direction of the wind as if the boat were “stopped”. This global setting determines whether “stopped” means relative to a point on the ground or to the water.
· Power boaters may prefer to use the “Ground” setting of this parameter. This gives the speed and direction of the Wind as if the receiver were sitting on the ground, facing in the same direction as the bow of the boat. To calculate True wind speed with a Ground reference from the Apparent Wind requires
o Course over Ground from a GPS (e.g. GPS200)
o Speed over Ground from a GPS (e.g. GPS200)
o Heading from a Compass (e.g. SSC200)
· Sail boaters may prefer to use the “Water” setting. This gives the speed and direction of the wind as if the receiver were drifting in the water facing in the same direction as the bow of the boat. To calculate True wind speed with a Ground reference from the Apparent Wind requires
o Speed though Water from a Log (e.g. DST110)
· The last setting Station should only be used for land-based installations where there is no movement. This requires no other data, assuming that all speeds are zero.
9.4.12.3 Default Units
This section of the “Units Setup” dialog you to choose the default units which are selected when creating components to measure various types of parameters. You are given the opportunity to select units other than the default units when you are creating or modifying components using the Component Editor.
9.4.12.3.1 Barometric Pressure
· bar,
· millibar (mbar),
· inches mercury (inHg),
· Kilopascal (kPa),
· Millimeters Mercury (mmHg)
9.4.12.3.2 Depth
· Feet,
· Fathoms,
· Meters (Metres)
· Yards
9.4.12.3.3 Distance
· Kilometers,
· Nautical Miles,
· Statute Miles
9.4.12.3.4 Fluid Pressure
· Bar (bar),
· Kilopascal (kPa),
· Pounds/Square Inch (psi)
9.4.12.3.5 Speed
· Kilometers/Hour (km/h),
· Nautical Miles/Hour (knots),
· Miles/Hour (mph)
9.4.12.3.6 Temperature
· Degrees Centigrade,
· Degrees Fahrenheit
9.4.12.3.7 Volume
· Imperial Gallons (gal(imp)),
· Liters (litre),
· US Gallons (gal(US))
9.4.12.3.8 Wind Speed
· Beaufort (Bft),
· Kilometers/Hour (km/h),
· Nautical Miles/Hour (knots),
· Miles/Hour (mph)
· Meters/Second (m/s)
9.4.12.3.9 Motion Distance
· Inches (in),
· Feet (ft)
· Millimeters (mm)
· centimeters (cm)
· meters (m)
9.4.12.3.10 Motion Velocity
· m/sec,
· feet/sec
· inches/sec
· mph
· km/h
· knots
9.4.12.3.11 Motion Acceleration
· m/s2,
· Feet/sec2,
9.4.12.3.12 Motion Angular Velocity
· Degrees/min,
· Degrees/sec
9.4.12.3.13 Motion Angular Acceleration
· Degrees/min2,
· Degrees/sec2,
9.4.12.3.14 Electrical Resistance
· Ohm,
· kiloOhm
9.4.12.3.15 Mechanical Force
· Newtons,
· kiloNewtons,
· Pound-force,
· Kilogram-force,
· Ton-force (metric)
· UK ton-force
· US ton-force
9.5 Available Component Types
This section lists the different types of components that are available to view parameters in N2KView. The types of component available depend on the parameter being displayed. Section 9.6 below lists the different component types available for each parameter type.
Where the name of the component is followed by (2x1) this gives the aspect ratio of the component as width x height. e.g. Active Button (4x1) is four times wider than it is high. When there is no aspect ratio, the control can be assumed to be square (1x1).
9.5.1 Active Button (4x1)
An Active Button will perform an action in the system when it is pressed.

Figure 29 – Active Button (4x1) Example
These are the actions that can be associated with an Active Button.
9.5.1.1 Connect N2K
Make a connection to the NMEA 2000 network.
9.5.1.2 Contract Graphs
The time base for all the graphs on the currently displayed page will be made one value smaller. This has the same effect as simultaneously pressing the down arrow on all the graphs on the page.
9.5.1.3 Expand Graphs
The time base for all the graphs on the currently displayed page will be made one value larger. This has the same effect as simultaneously pressing the down arrow on all the graphs on the page.
9.5.1.4 Print Screen
If the Diagnostic display is visible, its contents are copied to a USB drive (on an MBB300C / TSM810C) or the N2KSnapshots sub-directory under the Documents directory ( if running on a PC ).
If the Diagnostic display is not visible, a screenshot will be captured to USB drive (on an MBB300C / TSM810C) or the N2KSnapshots sub-directory under the Documents directory ( if running on a PC ).
9.5.1.5 Reset All Counters
All the counters on the page will be reset. If the counter is a hardware counter (i.e. the count is maintained by a device on the NMEA 2000 bus, such as a SIM100) a command will be sent to the device to reset its counter. This has the same effect as simultaneously pressing the reset button on all the counters on the page.
Because this operation cannot be undone, the Active Button must be held down for 1 second before the counters are reset.
9.5.1.6 Reset All Max/Min
All the components on the page with history markers on the page will be reset to the current value. This has the same effect as simultaneously pressing the reset button on all the controls with history markers on the page.
Because this operation cannot be undone, the Active Button must be held down for 1 second before the counters are reset.
9.5.1.7 Reset All Timers
All the timers on the page will be reset. If the timer is a hardware timer (i.e. the time is maintained by a device on the NMEA 2000 bus, such as a SIM100) a command will be sent to the device to reset its timer. This has the same effect as simultaneously pressing the reset button on all the timers on the page.
Because this operation cannot be undone, the Active Button must be held down for 1 second before the timers are reset.
9.5.1.8 Screen Select
An Active Button allows the user for jump directly to a screen or dialog without having to display and press on one of the drop-down tabs. For those User Defined screens that are not included in the drop down tabs (see 9.4.9.2.3), this component must be used to navigate to those screens.
Note that these options will display the target screen or dialog without requesting a password. This allows the system designer to gives access to parts of the system that would normally be password protected.
The Screen Select option has the following button types:
· Screen Select - The Alerts Screen or any User-defined screen
· Back – the previously viewed screen
· Home – a direct jump to the first screen with “home” in its name.
· Vessel Mode – a direct jump to the first screen with the Vessel Operating Mode in its name.
· Power – Open the Power Management menu
· Breaker Lockout – Open the Breaker Lockout Dialog
· Breaker Status – Open the Breaker Status Dialog
· About – Open the About Dialog
· Clean Screen – Open the Clean Screen Dialog
· General Configuration – Open the General Configuration Dialog
· Operating Mode – Open the Operating Mode Dialog
· AC Load Shed Source – Open The AC Load Shed Source Dialog
9.5.1.9 Set Mode to Anchored
The Vessel Operating mode is changed to Anchored. This action bypasses the password protection – only place the button on the screen if you want to make this action available without requiring a password.
9.5.1.10 Set Mode to Disabled
The Vessel Operating mode is changed to Disabled. This action bypasses the password protection – only place the button on the screen if you want to make this action available without requiring a password.
9.5.1.11 Set Mode to Moored
The Vessel Operating mode is changed to Moored. This action bypasses the password protection – only place the button on the screen if you want to make this action available without requiring a password.
9.5.1.12 Set Mode to Underway
The Vessel Operating mode is changed to Underway. This action bypasses the password protection – only place the button on the screen if you want to make this action available without requiring a password.
9.5.1.13 Set Mode to User1
The Vessel Operating mode is changed to User 2. This action bypasses the password protection – only place the button on the screen if you want to make this action available without requiring a password.
9.5.1.14 Set Mode to User2
The Vessel Operating mode is changed to User 2. This action bypasses the password protection – only place the button on the screen if you want to make this action available without requiring a password.
9.5.1.15 Show Tabs
The tabs are displayed when this button is pressed.
9.5.1.16 Toggle Day/Night Mode
The screen mode is changed between Day and Night Mode when this button is pressed.
9.5.2 Active Button Gray (4x1)
This component has the same functionality as the Active Button (4x1), but is darker.

Figure 30 – Active Button Gray (4x1) Component Example
9.5.3 Active Button (2x1)
This component has the same functionality as the Active Button (4x1), but is twice as wide as it is high. It can display more than one line of text.
Figure 31 – Active Button (2x1) ComponentExample
9.5.4 Active Button Gray (2x1)
This component has the same functionality as the Active Button (2x1), but is darker.
Figure 32 – Active Button Gray (1x1) Component Example
9.5.5 Active Button Invisible (1x1)
This creates an invisible square on the screen that when pressed with execute the desired action. When editing a screen, these buttons are shown as a dashed outline. The title of the control is optional.
Figure 33 – Active Button Invisible (1x1) Component Example
9.5.6 Air Conditioning / Heating
The MarineAir Elite and CruiseAir Q-Logic Air Conditioning Controls manufactured by Dometic have CAN bus support through an optional J1939 connector. With the insertion of a Maretron J2K100 – J1939 to NMEA 2000 Gateway ( http://www.maretron.com/products/j2k100.php ) , the PGNs from the Air Conditioners may be transmitted to N2KView and displayed. Each Air Conditioner will require a separate J2K100 Gateway. With the licensing of the Control Module, the Air Conditioner may also be controlled remotely. While the component is visually designed to look like a Cabin Controller for the MarineAir Elite range, it will display data from both the Elite and Q-Logic Controllers, using either Direct Expansion or Chilled Water, and fitted with the optional CAN-bus network adapter.
The following figure shows an Elite Air Conditioner with three fan speeds and set to Auto Mode. The simultaneous display of Auto and the Heat symbol shows that it has automatically been placed into Heat mode to try to raise the ambient temperature to the set point value.
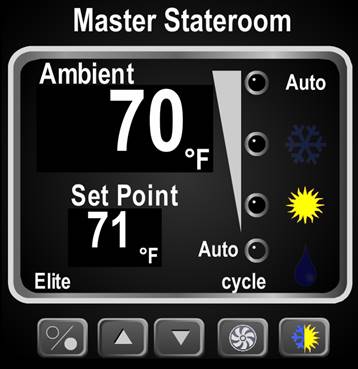
Figure 34 – Air Conditioner Component Example
The Buttons from left to right have the following functions
![]() On/Off.
Pressing this button will cycle the Air Conditioner On or Off. In the Off
state, it will continue to display the ambient temperature in the room, and the
fan may be switched.
On/Off.
Pressing this button will cycle the Air Conditioner On or Off. In the Off
state, it will continue to display the ambient temperature in the room, and the
fan may be switched.
![]() Adjust
Set Point Temperature. Pressing these buttons will adjust the Set Point
Temperature Up and Down. The new temperature is transmitted to the Air
Controller, which will then transmit the updated the values on the bus and only
on receipt of these values will the Set Point Display be updated.
Adjust
Set Point Temperature. Pressing these buttons will adjust the Set Point
Temperature Up and Down. The new temperature is transmitted to the Air
Controller, which will then transmit the updated the values on the bus and only
on receipt of these values will the Set Point Display be updated.
![]() Fan
Control. Pressing this button will cycle the fan through the Auto mode, and the
speeds allowed by the Air Controller. The Elite AC Controller has three manual
speeds. The Q-Logic Controller has either three or five speeds. If the button
is pressed and held, then the Fan will switch between Continuous and Cycled
operation.
Fan
Control. Pressing this button will cycle the fan through the Auto mode, and the
speeds allowed by the Air Controller. The Elite AC Controller has three manual
speeds. The Q-Logic Controller has either three or five speeds. If the button
is pressed and held, then the Fan will switch between Continuous and Cycled
operation.
![]() Operating
Mode Control. Pressing this button will cycle through the Operating Modes of
the AC Controller. These are Auto, Cool, Heat and Dehumidify; the current
Operating Mode is shown by lighting one of the symbols directly above the
button. If the Q-Logic AC Controller has Auxiliary Heat capability, then this mode
will be included in the cycle.
Operating
Mode Control. Pressing this button will cycle through the Operating Modes of
the AC Controller. These are Auto, Cool, Heat and Dehumidify; the current
Operating Mode is shown by lighting one of the symbols directly above the
button. If the Q-Logic AC Controller has Auxiliary Heat capability, then this mode
will be included in the cycle.
The following figure shows a Q-Logic Air Conditioner with five fan speeds and set to Auto Mode with an Auxiliary Heat option.
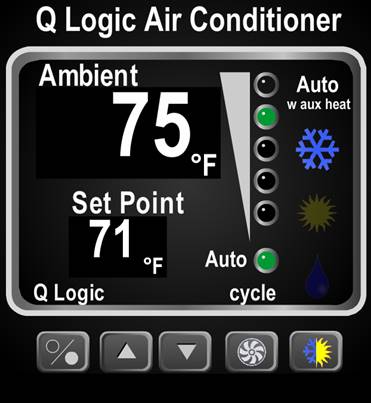
Figure 35 – Q-Logic Air Conditioner Component with Aux Heat
Please refer to the Marine Air Systems Elite Air Conditioner documentation for further details.
9.5.7 Analog Clock
The analog clock component emulates a traditional clock. To the bottom right of the clock, the units will show the time zone offset, am or pm. The label at the top is user-defined. The analog clock component is square in aspect ratio; for example, an analog clock component that is eight grids tall will be eight grids wide.
If the time is unknown, the hands of the clock will be dimmed.
An example of an analog clock component is shown below.
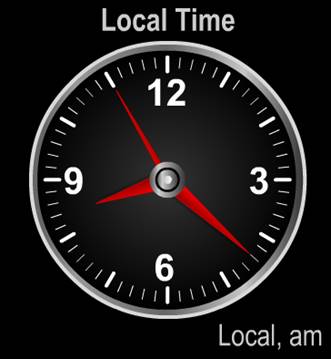
Figure 36 – Analog Clock Component Example
9.5.8 Anchor Watch
The Anchor Watch Component is a special type of gauge that graphically displays the parameters of the Anchoring Module (see section 13). A button on the gauge informs the Anchoring Module that the Anchor has been dropped or retrieved. As you drop anchor, push the button, and you have an anchor watch in place.
An example of the Anchor Watch Component is shown below.
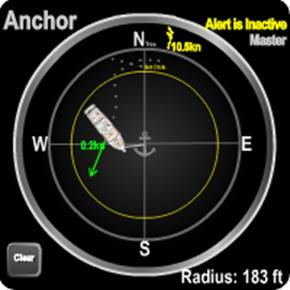
Figure 37 – Anchor Example
The control is centered on the position of the anchor, and shows the position of the boat, with crumbs showing track history, wind data, and boat movement. Graphically, the outer gray circle represents the radius of the alert, the Drag Radius, which is also show at the bottom right. The inner yellow circle represents the Set Radius, which is the maximum distance from the anchor to the hawsepipe for the deployed rode at the tide level when the anchor is dropped.
The top of the control will show either true or magnetic north depending on the preference set in the Units dialog.
The boat is oriented according to the its heading, with a green vector showing the current course over ground annotated with the speed over ground. Outside the circle is the wind vector.
If there is an anchor alert in the system that is currently active, this will be shown in the top right corner, and if this console has master status this will also be shown in the top right. A yellow circle with the radius of the anchor alert may be shown as well, if the alert is active.
Crumbs on the track history may be clicked to show the time, position, and water depth when that boat position was recorded.
9.5.9 Attitude Indicator
The Attitude Indicator or Artificial Horizon is used to display a combination of the ship’s pitch and roll motion. The blue and brown background will rotate to show the roll, which is also displayed digitally. The background also moves up and down to show the pitch. The User-defined title appears at the top, and the units at the bottom right. The component is square. An example of an attitude indicator component is shown below.
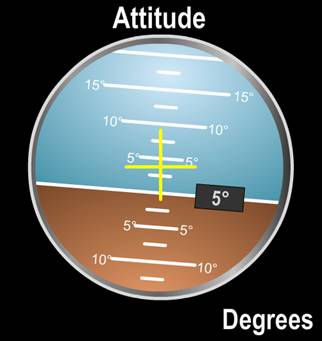
Figure 38 – Attitude Indicator Example
9.5.10 Bar Graph Vertical (1x2)
The bar graph component is similar in appearance to a mercury or alcohol thermometer or a liquid gauge. It consists of a vertical bar which is filled with color from the bottom of the bar graph to a height which corresponds to the value of the parameter on the scale which appears immediately to the right of the bar. Similar to the gauge component type, a user can define different ranges of parameter values to appear different colors on the component. In the case of the bar graph, the filled region itself will change color between green, yellow, and red depending on which range the parameter value falls into. Depending on the parameter, you may also be able to modify the range of values appearing on the scale of the bar graph. The user-defined title of the bar graph appears vertically-aligned on the left-hand side of the bar graph. The units of the parameter value being displayed appear at the bottom of the bar graph. An example of a bar graph component is shown below.
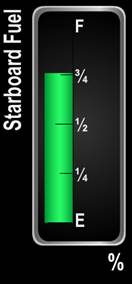
Figure 39 – Bar Graph Component Example
Min / Max history markers may be added to a bar graph by clicking on a check box in the Component Editor. These marks are associated with the control itself. That means that if two controls are displaying the same data, each will maintain its own values for the min max marks, and they can be reset independently.
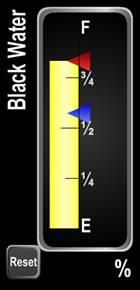
Figure 40 – Bar Graph Example with Min Max Marks
The min mark is a blue triangle to the right of the bar, and is “pushed” upwards by the top of the bar. The max mark is a red triangle just outside the color band and is “pulled” downwards by the top of the bar. Pressing the Reset button will move both marks to the current bar position.
The min and max history marks may be enabled and disabled independent of each other. The Reset button is displayed only if either of the marks is enabled.
9.5.11 Borderless Bar
This is a specialized version of the Bar Graph. It may only be accessed from Water Pressure Parameter, and is designed to display water pressure in feet or meters.
The component has a 2x1 aspect ratio, and the bar, which is always blue, occupies the entire width and grows upward as the pressure increases. Multiple bars may be stacked next to each other (side by side) to show the water level of tanks, or the water line on the hull as shown below.
One Borderless Bar has been selected for editing in this diagram. It has been created 2 wide by 4 high as shown by the yellow outline.
If a pressure transducer is located below the waterline, as the boat sinks deeper into the water the pressure will increase and the height of the blue bar will increase, giving an easy indication of how deep the boat is in the water.
Figure 41 – Borderless Bar Component Example
9.5.12 Circuit Breaker / Rocker Switch (2x1)
The circuit breaker or switch component emulates a physical switch. When the monitored value is “off”, the left-hand side of the switch, which is labeled “O” appears depressed and the switch appears gray in color. When the monitored value is “on”, the right-hand side of the switch, which is labeled “|”, appears depressed and also lights with a green color as if the switch contained a light or LED. The user-defined title of the switch appears immediately above the rocker switch itself. The rocker switch component is twice as wide as it is tall; for example, a rocker switch that is two grids tall will be four grids wide.
Touching anywhere on the left half of the control will turn the switch off, and touching anywhere on the right half will turn it on.
Rocker switches may be configured to be toggle (i.e. when you turn it on it stays on), momentary on (i.e. when you stop pressing the ON part it will return to the off position), or momentary off (i.e. when you stop pressing the OFF part it will return to the on position).
Doing a long press on the title of a breaker / rocker switch will display the Breaker / Switch Status dialog for that breaker as an aid to diagnosing the fault.
An example of a rocker switch component is shown below.
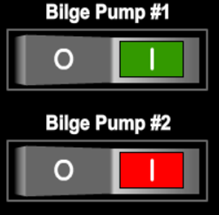
Figure 42 – Rocker Switch Component Examples
A Breaker that identifies itself as a GFCI Breaker will be overlaid with the text GFCI when not tripped.
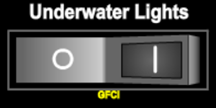
Figure 43 – GFCI Breaker
Breakers that report the cause of being tripped as a GFCI fault, or GFCI end-of-life will have this annotated on the control
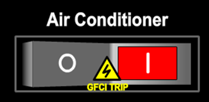
Figure 44 – GFCI Tripped Breaker
It is possible that control of the Breaker has disabled from other devices on the NMEA 2000 bus, such as the Carling DC boxes being put into Local mode; the breakers may only be controlled from or by the device locally. If this is reported to N2KView, the component will be overlaid with the text Local Override.
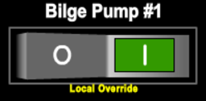
Figure 45 – Breaker with Local Override
If the Breaker or Switch is being controlled by a Timer (i.e. allocated a Flash Map) in its controller, the component will be overlaid with the text Timer Controlled. This is dependent on the breaker reporting its status as CYCLE_ON, CYCLE_OFF, TIMED_ON, or TIMED_OFF in PGN 127500.
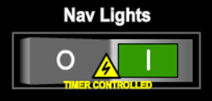
Figure 46 – Breaker under Timer Control
Switches that have been LOCKed in either the on or off position have the on or off system replaced with a LOCKED symbol (padlock) replacing the action that cannot be performed..
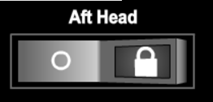
Figure 47 – Locked Rocker Switch
Switches that control a Breaker/Switch Group are overlaid with the text Group Switch.
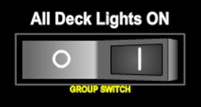
Figure 48 – Group Switch
Switches that are part of a Breaker/Switch
Group may be overlaid with the text Group Controlled in yellow. This
may be suppressed in the Switch/Breaker Group Edit dialog. (see 0)

Figure 49 – Group Controlled Rocker Switch
Breakers that are controlled by Alert in this instance of N2KView may be overlaid with the text Alert Controlled. This may be suppressed in the Switch/Breaker Group Edit dialog. (see 0)
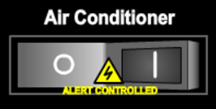
Figure 50 – Alert Controlled Rocker Switch
When a breaker or switch is being controlled by the N2KView Load Controller, the control is overlaid with a LOAD SHED or LOAD CONTROLLED symbol. Users should take note that the switch may be activated or deactivated without warning, and must be considered alive even though it is in the OFF position.
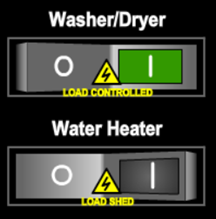
Figure 51 – Load Controlled Rocker Switch
9.5.13 Rocker Switch Left/Right (6x1)
These two controls have the same functionality as the Rocker Switch (2x1), but with the title moved to the left or right of the switch. These controls are designed to be stacked to mimic a typical breaker box.
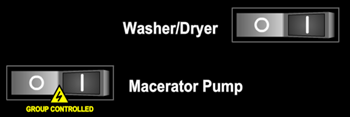
Figure 52 – Rocker Switch (6x1) Component Example
9.5.14 Switch Vertical
An alternative to the Switch is the Vertical Switch, which has the same functionality, but is square in aspect ratio, and has a transparent background. The text is always white.
The embedded color is user defined, and can be set to different colors for each state.
The figure below shows two switches, the left switch is in the ON state with a yellow color; the right switch is in the OFF state with a black color.
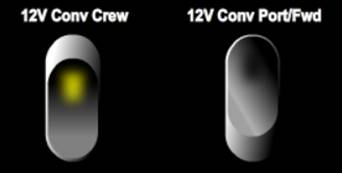
Figure 53 – Vertical Switch Component Examples
9.5.15 Digital (1x1)
The digital component shows the value of the displayed parameter in a numeric format. The value of the parameter is in the center of the component, the user-defined title appears at the top of the component, and the units of the parameter measurement appear in the lower right of the component. Digital components are square in aspect ratio (take the same number of grids in height as they do in width).
If the value is unknown, the display will show “-“.
Two examples of a digital component are shown below.
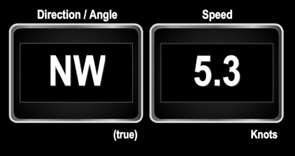
Figure 54 – Digital Component Examples
Digital components may be colored to show if the value is within a yellow or red range. When configuring the component, you may select the ranges of data for which each color is used black or green (normal), yellow border (warning) or solid red background (fault).
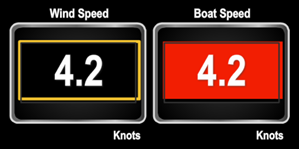
Digital Controls for trip parameters will have a Reset button in the bottom left corner.
Digital (1x1) components may also be configured to show max / min history values. These are shown below the current value.
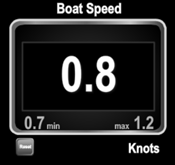
9.5.16 Digital (4x3)
Similar to the Digital (1x1), but in a more compact 4x3 aspect ratio. The history max/min values are not available.
Figure 55 – Digital (4x3) Component Example
9.5.17 Digital (3x2)
Similar to the Digital (1x1), but in a more compact 3x2 aspect ratio. The history max/min values are not available.

Figure 56 – Digital (3x2) Component Example
9.5.18 Digital (2x1)
Similar to the Digital (1x1), but in a very compact 2x1 aspect ratio. The history max/min values are not available.

Figure 57 – Digital (2x1) Component Example
This screenshot shows all the
9.5.19 Digital Invisible (2x1)
This is also a 2x1 component, without the title, border, or units. This can be used easily to display dates and times that don’t need titles or units, or where the designer wants the ability to design the titles and units into a graphical background image.

Figure 58 – Digital Invisible (2x1) Component Example
The following screenshot shows all the variants of the Digital components.
![]()
Digital (1x1)
Digital (4x3)
Digital (3x2)
Digital (2x1)
Digital Invisible Wide (2x1)
Figure 59 – All Digital Components
9.5.20 Digital Counter
The digital counter component shows a count of the number of transitions of an indicator value since the counter was last reset. The count is in the center of the component with the date and time of the last reset just below it, the user-defined title appears at the top of the component, and the units of the parameter measurement appear in the lower right of the component. A reset button allows the counter to be reset. Digital counter components are square in aspect ratio (take the same number of grids in height as they do in width). An example of a digital counter component is shown below.
Figure 60 – Digital Counter Component Example
When configuring the component, you may select whether the transitions to be counted are to the Off, On or Error states.
9.5.21 Dimmer (2 Button)
This is a 1x2 component, that may be used to control circuits with PWM dimming, such as in the MPower CLMD12 or CLMD16.
Figure 61 – Dimmer (2 Button) Component Example
This is a two button component with a slider on the right showing the current dim level. Clicking on the Up Button will turn the channel on at its last brightness. Holding the top button down will increase the brightness. Clicking the bottom button will turn the channel off, and holding it will decrease the brightness.
The green circle on the right may be dragged up and down to set the brightness.
9.5.22 Dimmer (3 Button)
This is a 1x2 component, that may be used to control circuits with PWM dimming, such as in the MPower CLMD12 or CLMD16.
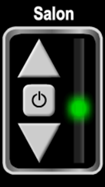
Figure 62 – Dimmer (3 Button) Component Example
This is a three button component with a slider on the right showing the current dim level. Clicking or holding, the Up Button will increase the brightness. Clicking or holding the bottom button will decrease the brightness. Clicking on the center button will toggle the channel on and off at the last set brightness.
The green circle on the right may be dragged up and down to set the brightness.
9.5.23 Dometic Ice Maker
The Eskimo Ice range of Ice Makers manufactured by Dometic have a J1939 connector. With the insertion of a Maretron J2K100 – J1939 to NMEA 2000 Gateway ( http://www.maretron.com/products/j2k100.php ) , the PGNs from the Ice Makers may be transmitted to N2KView and displayed. Each Ice Maker will require a separate J2K100 Gateway. With the licensing of the Control Module, the Ice Maker may also be switched On and Off remotely.
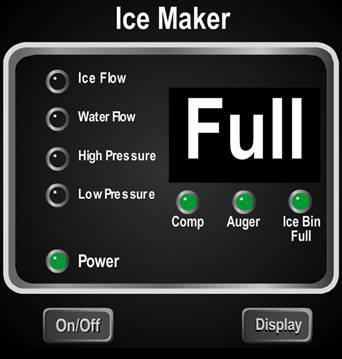
Figure 63 – Ice Maker Component Example
Pressing the On/Off button will command the unit to turn On or Off, if the Control Module has been licensed.
Pressing the Display button will cycle the display through Status, Compressor Current, Auger Current and AC Voltage.
Please refer to the Eskimo Ice Maker documentation for further details.
9.5.24 Gauge (1x1)
The gauge component emulates a mechanical gauge, with a needle whose axis is in the center of the gauge. The range of values displayed by the gauge is user-defined. The gauge has major (large, numbered) and minor (small, unnumbered) tick marks. You can define the number and spacing of these tick marks. You can also define different colors to denote different ranges of values on the gauge component. The colors green (okay), yellow (warning), and red (fault) are available. You can optionally define one green and up to two yellow and two red ranges of values that appear on the gauge scale. The value of the parameter on the scale of the gauge is pointed to by the needle. The value of the parameter also appears in a small digital display in the lower center of the gauge. The units of the parameter measurement appear in the lower right hand corner of the gauge, and the user-defined title is at the top of the gauge display. The gauge components are square in aspect ratio (take the same number of grids in height as they do in width). An example of a gauge component is shown below.
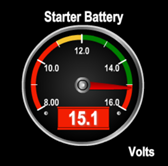
Figure 64 – Gauge Component Example
The digital display inside the gauge component is also colored to reflect the color of the range of values (red, yellow, or green) to which the needle is pointing.
Min / Max history markers may be added to a gauge by clicking on a check box in the Component Editor. These marks are associated with the gauge itself. That means that if two gauges are displaying the same data, each will maintain its own values for the min max marks, and they can be reset independently.
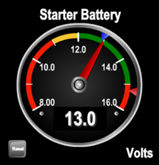
Figure 65 – Gauge with Min Max Markers
The min mark is a blue triangle just outside the color band, and is “pushed” to the left by the needle. The max mark is a red triangle just outside the3 color band and is “pushed” to the right by the needle. Pressing the Reset button will move both marks to the current needle position.
The min and max marks may be enabled and disabled independent of each other. The Reset button is displayed only if either of the marks is enabled.
9.5.25 Gauge (5x6)
This gauge is the same as Gauge (1x1) but with a 5x6 aspect ratio.
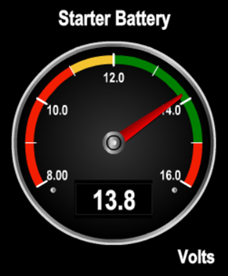
Figure 66 – Gauge (5x6) Component Example
9.5.26 GPS Status
The GPS Status component shows the following data about the selected GPS receiver:
- GPS operating mode (2D, 3D, DGPS)
- Satellite signal strength (up to 12 satellites)
- Satellite azimuth and elevation (up to 12 satellites)
- Position
- HDOP (Horizontal dilution of precision)
- Time
- Date
- Accuracy of position calculation
The satellite that is being used as the SBAS satellite is highlighted in red.
A user-defined title appears at the top of the GPS status component. The GPS status component is square in aspect ratio; for example, a GPS status component that is four grids wide will be four grids high. An example of a GPS status component is shown below.
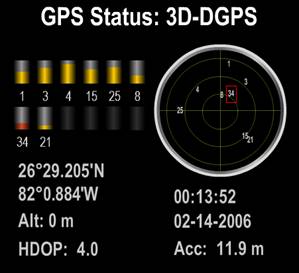
Figure 67 – GPS Status Component Example
9.5.27 Head Up Rose
The Head Up rose component is a compass rose in which a red needle always appears at the top, and the face of the compass rotates so that the red needle points in the direction indicated by the measured parameter value. The values “N”, “W”, “E”, and “S” appear at the four cardinal compass points, and decimal labels appear every 30 degrees. The user-defined title appears above the compass rose. The Head Up rose component is square in aspect ratio; for example, a Head Up Rose component that is four grids wide will be four grids high.
If the value is unknown, the needle will be dimmed.
An example of a Head Up Rose component is shown below.
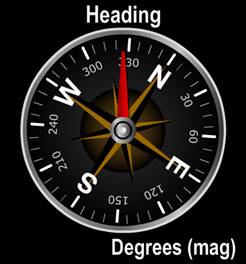
Figure 68 – Head Up Rose Component Example
9.5.28 Inclinometer
The inclinometer is used to display the ship’s roll, as reported from the compass. It is calibrated so that the red needle always points down. The User-defined title appears at the top, and the units at the bottom right. The component is square.
If the value is unknown, the needle will be dimmed.
An example of an inclinometer is shown below.
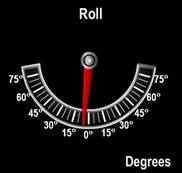
Figure 69 – Inclinometer Component Example
Min Max Markers may be added to an Inclinometer Component by clicking on a check box in the Component Editor. The markers show the limits of the needle movement in either direction. These marks are associated with the control itself. That means that if two controls are displaying the same data, each will maintain its own values for the min max marks, and they can be reset independently.
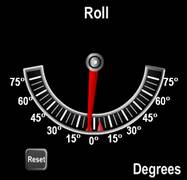
Figure 70 – Inclinometer with Min Max Marks
The marks are two red triangles just inside the gauge perimeter, and are “pushed” left or right by the needle. Pressing the Reset button will move both marks to the current needle position.
The Reset button is displayed only if the marks are enabled.
9.5.29 Indicator (4x1)
The Indicator 4x1 component displays a value which can be either “On”, “Off”, or “Error”. This component is most often used for engine or transmission warning indications, RIM100 status, or SIM100 status. The Indicator component has the appearance of a traditional physical warning light with a red bulb or LED. When the monitored parameter value is not available, the Indicator Light appears dim and gray in color. When the monitored parameter value is in any of the defined states, the Indicator 4x1 component glows with a user-defined color. The user-defined title of the Indicator 4x1 component appears across the middle of the component. The component is four times as wide as it is tall; for example, an Indicator Light component that is one grid tall will be four grids wide. An example of an Indicator 4x1 component is shown below.
![]()
Figure 71 – Indicator (4x1) Component Example
The title text will shrink in size to ensure that it fits in the control.
9.5.29.1 Different text in different states
The text inside the Indicator can be modified to change with the value. In the Component Edit Dialog check the box labelled Use Multiple Titles and enter different titles for each state.
9.5.30 Indicator (2x1)
This has the same functionality as the Indicator (4x1) component, but is twice as wide as it is high. It may display multiple lines of text.

Figure 72 – Indicator (2x1) Component Example
9.5.30.1 Different text in different states
The text inside the Indicator can be modified to change with the value. In the Component Edit Dialog check the box labelled Use Multiple Titles and enter different titles for each state.
9.5.31 Indicator (1x1)
The Indicator (1x1) component has the same functionality as the Indicator (4x1) component, but is square, and does not require a title. It is intended to be placed on a screen with a background, where its position on the background will convey its function to the user. For example the following screen segment with Indicator (1x1) components can show the status of Fire and CO alarms throughout the boat.
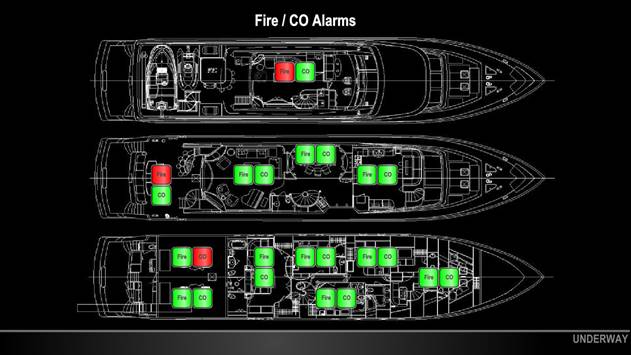
Figure 73 – Indicator (1x1) Component Example
9.5.32 Indicator Beam
There are 5 Indicator Beam Components.
![]()
Up
Left
Right
Down
Circle
Figure 74 – Indicator Beam Examples
Each of these has similar functionality to the Indicator Light, with the following additions.
- The available colors for the beam includes None as an option. This allows the beam to be programmed to disappear completely in one or more of the indicator states.
- The beams may be moved to overlap other components (or each other to create more complex beam shapes.)
This is an example of Indicator Beams being used to show navigation lights
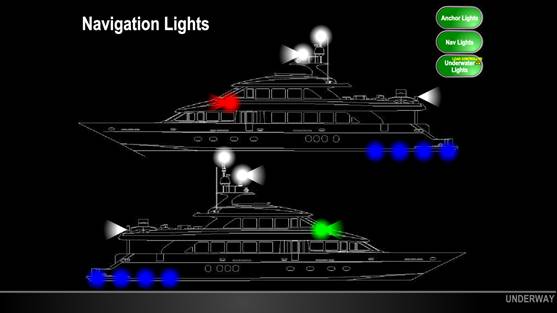
Figure 75 – User Defined Screen with Indicator Beams
9.5.33 Line Graph / Depth Graph / Indicator Graph
The line graph component emulates a traditional pen line graph plotter.
The depth graph is similar but has the lowest values at the top, and the line is replaced with a solid area below the values.
The Indicator Graph shows the history of Indicator state.
The line graph and depth graph components plot values of the monitored parameter over time, with the most recent values appearing on the extreme right edge of the graph and older values appearing farther to the left.
For ranges 10 minutes and less, a red line will show the values sampled from the database every 1 second.
For ranges 30 minutes and greater, a red line will show the average of the samples taken from the database for the sample period shown in the following table. Behind the red line a brown area will show the minimum and maximum values sampled over that period.
Hovering over the graph will display a textual representation of whatever average, minimum, or maximum value the cursor is over.
The X-axis scale, denoting the age of the data, appears at the bottom of the line graph and the range is specified below the component. Up and down arrow buttons are used to change the range. The following ranges are selectable:
|
Range |
Sample Period |
|
1 minute |
1 second |
|
4 minutes |
1 second |
|
10 minutes |
1 second |
|
30 minutes |
1 minute |
|
1 hour |
1 minute |
|
4 hours |
1 minute |
|
8 hours |
1 minute |
|
12 hours |
1 minute |
|
24 hours |
10 minutes |
|
48 hours (2 days) |
10 minutes |
|
4 days |
10 minutes |
The Y-axis scale, denoting the value of the data, appears at the right of the line graph. The maximum and minimum values can be set in the editor. While running, the graph may be moved up and down by “grabbing” a number on the y-axis and “dragging” it up or down – or by double-clicking a number on the y-axis. Clicking the top number will move it to the top of the display, clicking the bottom number will move it to the bottom, and clicking any other number will move it to the center.
The user-defined title of the graph appears at the top of the line graph component, while the units of the measured parameter value appear in the lower right-hand corner of the line graph component. The line graph component is square in aspect ratio; for example, a line graph component that is eight grids tall will be eight grids wide.
An example of a line graph component is shown below.
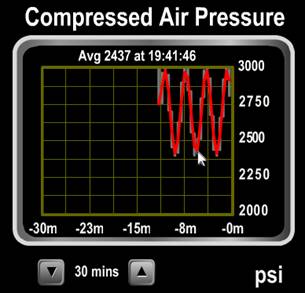
Figure 76 – Line Graph Component Example
And the following figure shows an example of the depth graph.
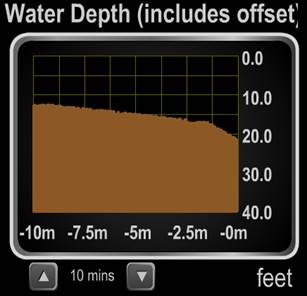
Figure 77 – Depth Graph Component Example
The following figure shows an example of an Indicator Graph. The colors of the graph are user selectable in the Component Editor.
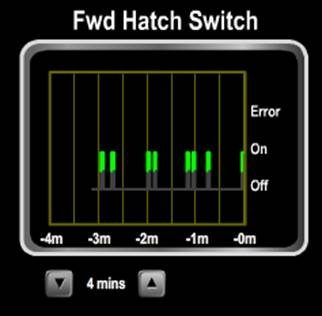
Figure 78 – Indicator Graph Example
9.5.34 Moon Phase
The moon phase component is a picture of what the moon looks like at the current date and time. In the center of the component is a picture of the moon with the proper percentage lit depending on the moon phase. A user-defined title appears at the top of the component, and a description of the current moon phase (“Full Moon”, “First Quarter”, etc.) appears at the bottom of the moon phase component. The moon phase component is square in aspect ratio; for example, a moon phase component that is four grids wide will be four grids high. An example of a moon phase component is shown below.

Figure 79 – Moon Phase Component Example
9.5.35 North Up Rose
The North Up Rose component is a compass rose, in which north always appears at the top and a red needle points in the direction indicated by the measured parameter value. The values “N”, “W”, “E”, and “S” appear at the four cardinal compass points, and decimal labels appear every 30 degrees. The user-defined title appears above the compass rose. The North Up Rose component is square in aspect ratio; for example, a North Up Rose component that is four grids wide will be four grids high.
If the value is unknown, the needle will be dimmed.
An example of a North Up Rose component is shown below.
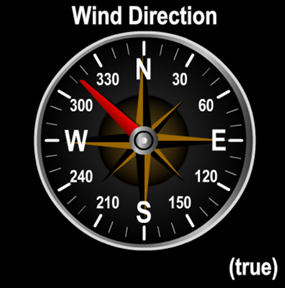
Figure 80 – North Up Rose Component Example
Min Max History Markers may be added to a North Up Rose by clicking on a check box in the Component Editor. The markers show the limits of the needle movement in either direction. These marks are associated with the control itself. That means that if two controls are displaying the same data, each will maintain its own values for the min max marks, and they can be reset independently.
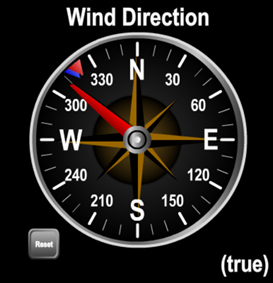
Figure 81 – North Up Rose with History Markers
The marks are two red triangles just inside the gauge perimeter, and are “pushed” left or right by the needle. Should either mark be “pushed” all the way round to meet the other mark, both marks will lock to the needle to indicate that the max min values are now meaningless. Pressing the Reset button will move both marks to the current needle position and unlock the marks.
The Reset button is displayed only if the marks are enabled.
9.5.36 Push Buttons
To supplement the toggle switches, there are five different push buttons.
In each case the on, off and error colors are specified by the user.
Push buttons may be configured to be toggle (i.e. you press it one to go on and then again to go off), momentary on (i.e. when you stop pressing it will return to the off position) or momentary off (i.e. when you stop pressing it will return to the on position).
All the pushbuttons may be overlaid with LOAD SHED, LOAD CONTROLLED, GROUP CONTROLLED, and LOCKED warnings in the same way as the Circuit Breaker. (see 9.5.12 for more details).
Doing a long press on a push button in the error state will display the Breaker / Switch Status dialog for that breaker as an aid to diagnosing the fault.
9.5.36.1 Backlit Pushbutton (1x1)
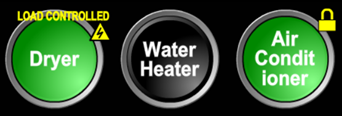
Figure 82 – Backlit Pushbutton (1x1) Component Examples
9.5.36.2 Backlit Pushbutton (2x1)

Figure 83 – Backlit Pushbutton (2x1) Component Examples
9.5.36.3 Metallic Pushbutton (1x1)
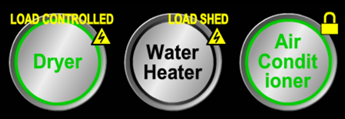
Figure 84 – Metallic Pushbutton (1x1) Component Examples
9.5.36.4 Wide Metallic Pushbutton (2x1)

Figure 85 – Metallic Pushbutton (2x1) Component Examples
9.5.36.5 Pushbutton (4x1)
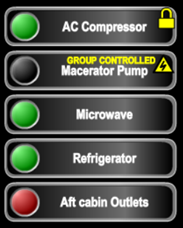
Figure 86 – Pushbutton (4x1) Component Examples
9.5.36.6 Invisible Push Button (1x1)

Figure 87 – Invisible Push Button (1x1) Component Example
The invisible push buttons are displayed as a circle, the color of which will be set by the user for each state of the push button. The internal text is optional, and one color that can be selected is “none” to render a truly invisible button. These can be overlaid on a feature of a background image or any other control to generate very complex user experiences.
9.5.37 Rate of Turn
The rate of turn component is a special type of gauge that displays the rate at which the vessel’s heading is changing, either in Degrees per Minute or Degrees per Second. The User-defined title appears at the top, and the units at the bottom right. The value is also displayed in digital form with turns to Port being shown as negative numbers.
An example of the Rate of Turn component is shown below.
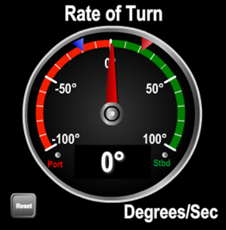
Figure 88 – Rate of Turn Component Example
Min Max Markers may be added to a Rate of Turn Component by clicking on a check box in the Component Editor. The markers show the limits of the needle movement in either direction. These marks are associated with the control itself. That means that if two controls are displaying the same data, each will maintain its own values for the min max marks, and they can be reset independently.
The marks are blue and red triangles just inside the gauge perimeter, and are “pushed” left or right by the needle. Pressing the Reset button will move both marks to the current needle position.
The Reset button is displayed only if the marks are enabled.
9.5.38 Rudder Angle / Order
The rudder angle component appears like a mechanical rudder angle gauge. There is a red needle in the center of the component and a semicircular scale appearing at the bottom component. The needle is oriented such that it points the same direction as the rudder if you were standing above it looking down while facing the bow of the vessel.
A gray triangle under the needle shows the order given to the rudder by an autopilot.
The range of values displayed by the gauge is user-defined. The gauge has major tick marks. You can define the number and spacing of these tick marks within the component editor.
If the rudder angle is unknown, the needle will be dimmed; if the rudder order is unknown, the gray triangle is omitted.
An example of a rudder angle component is shown below.
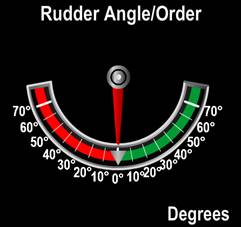
Figure 89 – Rudder Angle Component Example
Min Max Markers may be added to a Rudder Angle Component by clicking on a check box in the Component Editor. The markers show the limits of the needle movement in either direction. These marks are associated with the control itself. That means that if two controls are displaying the same data, each will maintain its own values for the min max marks, and they can be reset independently.
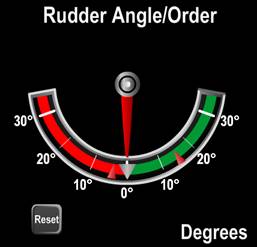
Figure 90 – Rudder Angle with Min Max Marks
The marks are two red triangles just inside the gauge perimeter, and are “pushed” left or right by the needle. Pressing the Reset button will move both marks to the current needle position.
The Reset button is displayed only if the marks are enabled.
9.5.39 Screen Status
The new Screen Status Component is a way of summarizing all the red and yellow values in gauges etc. into a single component.
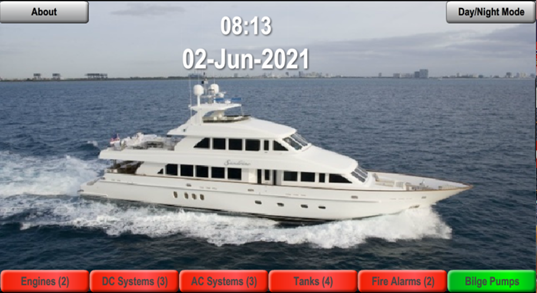
Figure 91 – Example Screen with Screen Status Components
The above shows a master screen summarizing the status of 6 other screens. If we look at the Engines Screen, we see the following:
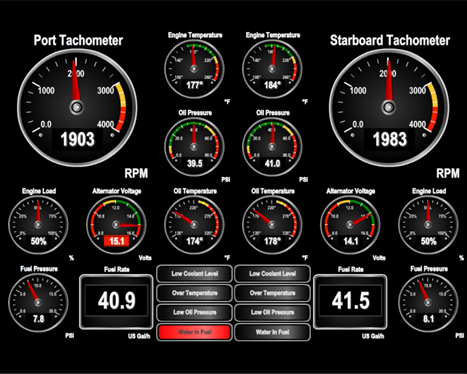
The Alternator Voltage Gauge is in the “red” plus there is a Water In Fuel alert coming from the engine. That summarizes to two components that are in the “red”, and this value is shown on the Screen Status component.
![]()
The color of the Screen Status component is given by the “worst” color on the screen referenced. It may also be green if no components are in “red” or “yellow” and at least one component is in “green”.
The number shown is the total number of components in the “red” and “yellow”. If only one component is in either of these ranges, then no number is shown.
Pressing the component will jump to the screen.
9.5.40 Signal Strength
The Signal Strength component is used to display the signal strength of the received mobile network by the SMS100. An example of a signal strength component appears below.
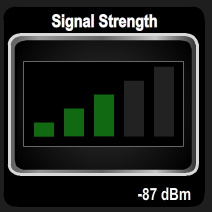
Figure 92 – Signal Strength Component Example
The signal strength is displayed in dBm below the component.
9.5.41 Status Bars (28x1)
The Status Bars are a linear component designed to be stacked and provide a unique view of data. The emphasis here is to display which color band the value is in. The bands themselves are always a fixed width, and while the position of the value mark in the band is proportional, the band widths are not scaled relative to each other. Even when viewing a screen containing many of these components from a distance, the red and yellow will stand out. They are a good way of showing a lot of components on a screen, with just a little detail on each component.

Figure 93 – Status Bar (28x1) Component Examples
The title is on the left, and a textual display of the value is on the right between the minimum and maximum values of the component. So the top component has a range from 6 to 16 Volts, but it is not clear where each band starts and stop. We do know that, at 13.0V, we are safely in the green band. The bottom component show that we are just over the minimum value of the red band.
The 5 bands represent the 5 ranges of a Gauge - low red, low yellow, green, high yellow and high red. If a band has not been defined by the user, the border is grayed out as in the high yellow band of the DC Voltage.
9.5.42 Status Bars (12x1)
These status bars take the concept further, removing more data to just display the digital value, and which range the data is in.

Figure 94 – Status Bar (12x1) Component Examples
9.5.43 Status Bars (8x1)
And this goes even one step further combing the red and yellow into a single indicator and removing the value. This is an extremely compact way of summarizing a lot of data as to whether they are in the green, yellow, or red.

Figure 95 – Status Bar (8x1) Component Examples
9.5.44 Tank
The Tank control performs the same function as the Bar Graph component, and is a direct substitute for use where the value to be displayed is the volume of liquid in a tank. It consists of a vertical cylinder which is filled with color from the bottom of the bar graph to a height which corresponds to the value of the parameter. The value is also displayed textually under the colored cylinder. Similar to the gauge component type, a user can define different ranges of parameter values to appear different colors on the component. As in the case of the bar graph, the filled region itself will change color between green, yellow, and red depending on which range the parameter value falls into. The user-defined title of the bar graph appears at the top of the component. The units of the parameter value being displayed appear at the bottom of the bar graph. An example of a tank component is shown below.
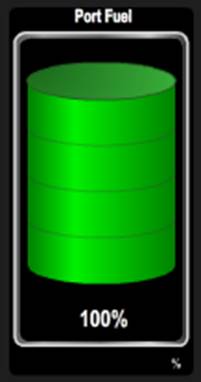
Figure 96 – Tank Component Example
Min / Max markers may be added to a tank component by clicking on a check box in the Component Editor. These marks are associated with the control itself. That means that if two controls are displaying the same data, each will maintain its own values for the min max marks, and they can be reset independently.
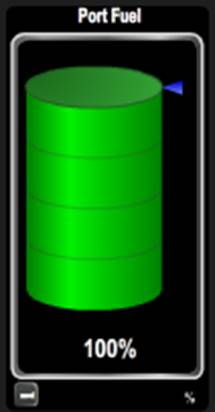
Figure 97 – Tank Component Example with Min Max Marks
The min mark is a blue triangle to the right of the cylinder, and is “pushed” upwards by the top of the liquid. The max mark is a red triangle to the right of the cylinder and is “pulled” downwards by the top of the liquid. Pressing the Reset button will move both marks to the current bar position. When the marks are displayed, the cylinder is made narrower to allow them to fit.
The min and max marks may be enabled and disabled independent of each other. The Reset button is displayed only if either of the marks is enabled.
9.5.45 Text
Text may be added to a Favorite Screen by using the Text Component. Text is displayed on one line in a component that is 4 times as wide as it is high. The text is entered as the title of the component.
An example of the Text component is shown below.

Figure 98 – Text Component Example
9.5.46 Multi-line Text
Larger quantities of text may be added to a Favorite Screen by using the Multi-line Text Component. Text is displayed on many lines in a 1:1, 2:1, or 4:1 aspect ratio. The text is entered as the title of the component.
The multi-line text component has a transparent background.
An example of the Multi-line Text component is shown below.
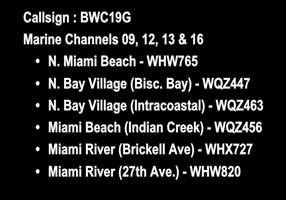
Figure 99 – Multi-line Text Component Example
For users with a rudimentary knowledge of HTML and CSS, the text may be styled using
· <font color=”#rrggbb” size=”nn”>Text</font>
· <li>List Item</li>
· <p align=”left|right|justify|center”>paragraph</p>
· <u>underline</u>
e.g.
<font size="18"><font color="#CC45E4"><u>FKEY PURPOSE</u></font>
<font color="#CC45E4">F1</font> JUMP TO HELP or SCREEN 1
<font color="#CC45E4">F2..F10</font> JUMP TO SCREEN #
<font color="#CC45E4">F11</font> MINIMIZE/MAXIMIZE WINDOW
<font color="#CC45E4">F12</font> OPEN LOG SCREEN
</font>
will display this text
![]()
Note that spaces will be respected, unlike normal HTML processing.
9.5.47 Text Message (SMS)
This control contains a history of text messages that were transmitted by the SMS100, and provides an area where text message may be entered for transmission.
The arrows at the top cycle through the conversations stored, and the phone number with user name as stored in the SMS Setup dialog are shown in the center.
Transmitted messages are in blue on the right; received messages in black on the left.
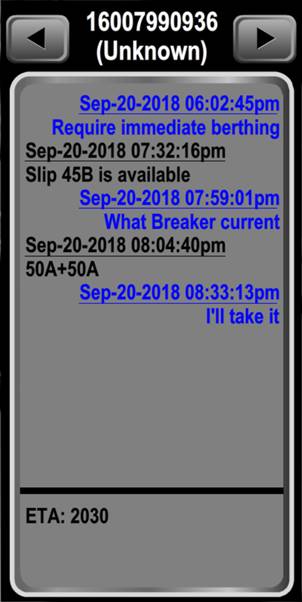
Figure 100 – Text Message (SMS) Component Example
9.5.48 Timer
The timer component shows the elapsed time an indicator value has been in a specified state since the timer was last reset. The elapsed time is in the center of the component with the date and time of the last reset just below it, the user-defined title appears at the top of the component, and the units of the parameter measurement appear in the lower right of the component. A reset button allows the timer to be reset. Timer components are square in aspect ratio (take the same number of grids in height as they do in width). An example of a Timer component is shown below.
Figure 101 –Timer Component Example
When configuring the component, you may select the indicator state in which the timer will increment, i.e. the Off, On or Error states.
9.5.49 Vacuum Gauge
A Vacuum Gauge is the same as a Gauge, but the needle will move clockwise with decreasing pressure.
9.5.50 Wind Angle
The wind angle component is similar in appearance to traditional mechanical wind angle gauges. An outline of a boat’s hull appears in the center of the component, and a red needle points directly into the wind. The gauge is labeled in increments to 30 degrees with intermediate tick marks at 10 degree intervals, from 0 degrees at the top to 180 degrees at the bottom on both port and starboard sides. The areas on the scale between 20 degrees and 60 degrees are colored red on the port side and green on the starboard side. The wind speed appears in a small digital display in the lower part of the circular gauge. A user-defined title appears at the top of the component, and the units of the wind speed measurement appear in the lower-right hand corner of the component. The wind angle component is square in aspect ratio; that is, a wind angle component that is four grids high will also be four grids tall.
If the wind direction is unknown, the needle will be dimmed; if the wind speed in unknown the digital insert will show “-“. A wind speed of zero will show an unknown wind direction.
An example of a wind angle component is shown below.
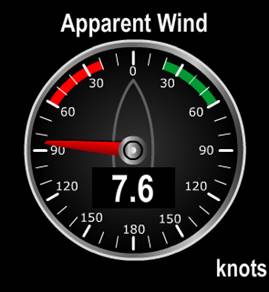
Figure 102 – Wind Angle Component Example
Min Max Markers may be added to a Wind Angle Component by clicking on a check box in the Component Editor. The markers show the limits of the needle movement in either direction. These marks are associated with the control itself. That means that if two controls are displaying the same data, each will maintain its own values for the min max marks, and they can be reset independently.
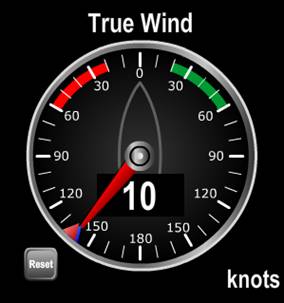
Figure 103 – Wind Angle Component with Min Max Marks
The marks are two red triangles just inside the gauge perimeter, and are “pushed” left or right by the needle. Should either mark be “pushed” all the way round to meet the other mark, both marks will lock to the needle to indicate that the max min values are now meaningless. Pressing the Reset button will move both marks to the current needle position and unlock the marks.
The Reset button is displayed only if the marks are enabled.
A second wind angle component with an expanded scale at the bow of the boat is also available for sailboats. This is the Close Angle component, and is shown below.
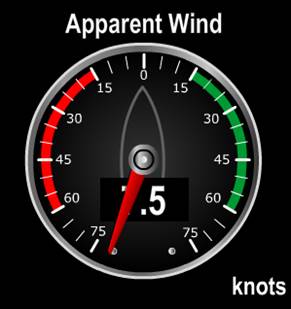
Figure 104 – Wind Close Angle Component Example
Min Max Markers may be added to a Close Angle Component by clicking on a check box in the Component Editor.
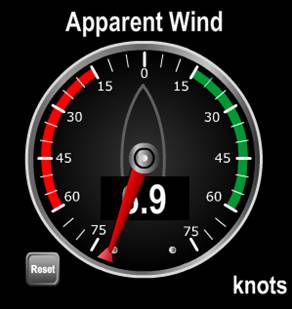
Figure 105 – Close Angle Component with Min Max Marks
The marks are two red triangles just inside the gauge perimeter, and are “pushed” left or right by the needle. Pressing the Reset button will move both marks to the current needle position.
The Reset button is displayed only if the marks are enabled.
9.5.51 Video
The Video Component is used to display video from IP Cameras. The component is square, and has a user defined label at the top.
If the camera supports Pan, Tilt and Zoom buttons under the video display will be enabled if a Component Type of Video with PTZ Controls is chosen.
If the camera does support the PTZ functions, then the user can select a Component Type of just Video for those locations where control of the video camera is undesirable (e.g. guest staterooms).
Video components are only available with the purchase of a Video module.
When displaying video, one of several component types may be chosen.
9.5.51.1 Video and Video with PTZ Controls
Figure 106 – Video Component Examples
This layout matches the format of the digital control. The first option (Video) will not display the control buttons whether the camera has PTZ capabilities or not. Use this component type when you do not want the viewers to have control over the camera. The second option will only display the PTZ controls if the camera has PTZ capability.
9.5.51.2 3:4 Video (No Border)
Figure 107 – 3:4 Video (No Border)Component Examples
This component is designed to show video from cameras that are mounted sideways. The title and controls are overlaid semi-transparently on the video. The video picture will be stretched to fit the display area. The title may be set to nothing to remove the overlay.
9.5.51.3 4:3 Video (No Border)
Figure 108 – 4:3 Video (No Border) Component Examples
The video picture will be stretched to fit the display area. The title may be set to nothing to remove the overlay.
9.5.51.4 16:9 Video (No Border)
Figure 109 – 16:9 Video (No Border) Component Examples44
This is designed to show video from cameras with widescreen aspect ratios. The video picture will be stretched to fit the display area. The title may be set to nothing to remove the overlay.
9.5.52 Watermaker
N2KView can display data sent over the NMEA 2000 bus by a Sea Recovery Watermaker equipped with an NMEA 2000 interface, or a Watermaker made by another company using the Sea Recovery proprietary PGNs. With the licensing of the Control Module, the watermaker may also be commanded to Stop, Start, and start a Flush cycle.
Recently NMEA has published standard PGNs for Watermakers and these may also be used to populate this control.
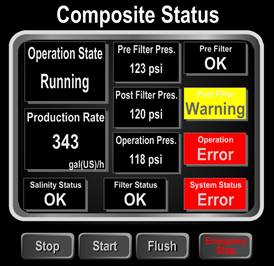
Figure 110 – Watermaker Component Example
Because the Emergency Stop cannot be restarted remotely, this action requires a second step to prevent accidental activation. The following confirmation message is displayed in the center of the component for 3 seconds.
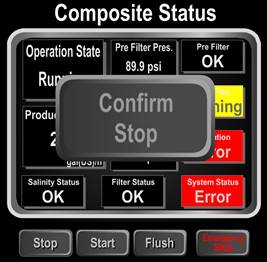
Figure 111 – Watermaker with request for Confirmation
If the user presses the confirm button, the command will be sent to the watermaker. If after 3 seconds the button has not been pressed, it will be erased and no command will be sent.
Sending a command will not change any of the displayed parameters. Only when the watermaker has received the command, and transmits new device parameters on the bus will the component to be updated with the new parameters received on the bus.
For details on the commands and values displayed, please refer the documentation supplied with the watermaker.
9.6 Available Data Types
The N2KView system organizes the various available data types into a two-level system of data Categories and data Types. Each data category consists of a number of closely-related data types.
9.6.1 AC Bus
9.6.1.1 Average Frequency
Displays the average frequency of all AC phases on an AC bus.
Component Types: Gauge, Status Bars, Digital, Line Graph
Instances: 253
Units: Hertz
9.6.1.2 Average Line-Line Voltage
Displays the average line to line RMS voltage of an AC bus.
Component Types: Gauge, Status Bars, Digital, Line Graph
Units: Volts RMS
Instances: 253
9.6.1.3 Average Line-Neutral Voltage
Displays the average line to neutral RMS voltage of an AC bus.
Component Types: Gauge, Status Bars, Digital, Line Graph
Units: Volts RMS
Instances: 253
9.6.1.4 Phase A Frequency
Displays the frequency of phase A on an AC bus.
Component Types: Gauge, Status Bars, Digital, Line Graph
Instances: 253
Units: Hertz
9.6.1.5 Phase A Line-Neutral Voltage
Displays the RMS voltage between phase A and neutral of an AC bus.
Component Types: Gauge, Status Bars, Digital, Line Graph
Units: Volts RMS
Instances: 253
9.6.1.6 Phase AB Line-Line Voltage
Displays the RMS voltage between phase A and phase B of an AC bus.
Component Types: Gauge, Status Bars, Digital, Line Graph
Units: Volts RMS
Instances: 253
9.6.1.7 Phase B Frequency
Displays the frequency of phase B on an AC bus.
Component Types: Gauge, Status Bars, Digital, Line Graph
Instances: 253
Units: Hertz
9.6.1.8 Phase B Line-Neutral Voltage
Displays the RMS voltage between phase B and neutral of an AC bus.
Component Types: Gauge, Status Bars, Digital, Line Graph
Units: Volts RMS
Instances: 253
9.6.1.9 Phase BC Line-Line Voltage
Displays the RMS voltage between phase B and phase C of an AC bus.
Component Types: Gauge, Status Bars, Digital, Line Graph
Units: Volts RMS
Instances: 253
9.6.1.10 Phase C Frequency
Displays the frequency of phase C on an AC bus.
Component Types: Gauge, Status Bars, Digital, Line Graph
Instances: 253
Units: Hertz
9.6.1.11 Phase C Line-Neutral Voltage
Displays the RMS voltage between phase C and neutral of an AC bus.
Component Types: Gauge, Status Bars, Digital, Line Graph
Units: Volts RMS
Instances: 253
9.6.1.12 Phase CA Line-Line Voltage
Displays the RMS voltage between phase C and phase A of an AC bus.
Component Types: Gauge, Status Bars, Digital, Line Graph
Units: Volts RMS
Instances: 253
9.6.2 AC Generator
9.6.2.1 Average Current
Displays the average AC RMS electrical current being sourced from a generator on all phases.
Component Types: Gauge, Status Bars, Digital, Line Graph
Instances: 253
Units: Amperes
9.6.2.2 Average Frequency
Displays the average frequency of the AC power from a generator on all phases.
Component Types: Gauge, Status Bars, Digital, Line Graph
Units: Hertz
Instances: 253
9.6.2.3 Average Line-Line Voltage
Displays the average line to line RMS voltage of the AC power from a generator.
Component Types: Gauge, Status Bars, Digital, Line Graph
Units: Hertz
Instances: 253
9.6.2.4 Average Line-Neutral Voltage
Displays the average line to neutral RMS voltage of the AC power from a generator.
Component Types: Gauge, Status Bars, Digital, Line Graph
Units: Hertz
Instances: 253
9.6.2.5 Phase A Apparent Power
Displays the Apparent Power being drawn on Phase A from a generator.
Component Types: Gauge, Status Bars, Digital, Line Graph
Instances: 253
Units: VA
9.6.2.6 Phase A Current
Displays the AC RMS electrical current being sourced from a generator on phase A.
Component Types: Gauge, Status Bars, Digital, Line Graph
Instances: 253
Units: Amperes
9.6.2.7 Phase A Frequency
Displays the frequency of the AC power from a generator on phase A.
Component Types: Gauge, Status Bars, Digital, Line Graph
Units: Hertz
Instances: 253
9.6.2.8 Phase A Line-Neutral Voltage
Displays the phase A to neutral RMS voltage of the AC power from a generator.
Component Types: Gauge, Status Bars, Digital, Line Graph
Units: Hertz
Instances: 253
9.6.2.9 Phase A Power Factor
Displays the Power Factor of phase A of the AC power from a generator.
Component Types: Digital
Units: %
Instances: 253
9.6.2.10 Phase A Reactive Power
Displays the Reactive Power being drawn on Phase A from a generator.
Component Types: Gauge, Status Bars, Digital, Line Graph
Instances: 253
Units: VAr
9.6.2.11 Phase A Real Power
Displays the Real Power being drawn on Phase A from a generator.
Component Types: Gauge, Status Bars, Digital, Line Graph
Instances: 253
Units: Watts / kilowatts
9.6.2.12 Phase AB Line-Line Voltage
Displays the voltage between Phase A and Phase B of the AC power from a generator.
Component Types: Gauge, Status Bars, Digital, Line Graph
Units: Hertz
Instances: 253
9.6.2.13 Phase B Apparent Power
Displays the Apparent Power being drawn on Phase B from a generator.
Component Types: Gauge, Status Bars, Digital, Line Graph
Instances: 253
Units: VA
9.6.2.14 Phase B Current
Displays the AC RMS electrical current being sourced from a generator on phase B.
Component Types: Gauge, Status Bars, Digital, Line Graph
Instances: 253
Units: Amperes
9.6.2.15 Phase B Frequency
Displays the frequency of the AC power from a generator on phase B.
Component Types: Gauge, Status Bars, Digital, Line Graph
Units: Hertz
Instances: 253
9.6.2.16 Phase B Line-Neutral Voltage
Displays the phase B to neutral RMS voltage of the AC power from a generator.
Component Types: Gauge, Status Bars, Digital, Line Graph
Units: Hertz
Instances: 253
9.6.2.17 Phase B Power Factor
Displays the Power Factor of phase B of the AC power from a generator.
Component Types: Digital
Units: %
Instances: 253
9.6.2.18 Phase B Reactive Power
Displays the Reactive Power being drawn on Phase B from a generator.
Component Types: Gauge, Status Bars, Digital, Line Graph
Instances: 253
Units: VAr
9.6.2.19 Phase B Real Power
Displays the Real Power being drawn on Phase B from a generator.
Component Types: Gauge, Status Bars, Digital, Line Graph
Instances: 253
Units: Watts / kilowatts
9.6.2.20 Phase BC Line-Line Voltage
Displays the voltage between Phase B and Phase C of the AC power from a generator.
Component Types: Gauge, Status Bars, Digital, Line Graph
Units: Hertz
Instances: 253
9.6.2.21 Phase C Apparent Power
Displays the Apparent Power being drawn on Phase C from a generator.
Component Types: Gauge, Status Bars, Digital, Line Graph
Instances: 253
Units: VA
9.6.2.22 Phase C Current
Displays the AC RMS electrical current being sourced from a generator on phase C.
Component Types: Gauge, Status Bars, Digital, Line Graph
Instances: 253
Units: Amperes
9.6.2.23 Phase C Frequency
Displays the frequency of the AC power from a generator on phase C.
Component Types: Gauge, Status Bars, Digital, Line Graph
Units: Hertz
Instances: 253
9.6.2.24 Phase C Line-Neutral Voltage
Displays the phase C to neutral RMS voltage of the AC power from a generator.
Component Types: Gauge, Status Bars, Digital, Line Graph
Units: Hertz
Instances: 253
9.6.2.25 Phase C Power Factor
Displays the Power Factor of phase C of the AC power from a generator.
Component Types: Digital
Units: %
Instances: 253
9.6.2.26 Phase C Reactive Power
Displays the Reactive Power being drawn on Phase C from a generator.
Component Types: Gauge, Status Bars, Digital, Line Graph
Instances: 253
Units: VAr
9.6.2.27 AC Generator Phase C Real Power
Displays the Real Power being drawn on Phase C from a generator.
Component Types: Gauge, Status Bars, Digital, Line Graph
Instances: 253
Units: Watts / kilowatts
9.6.2.28 Phase CA Line-Line Voltage
Displays the voltage between Phase C and Phase A of the AC power from a generator.
Component Types: Gauge, Status Bars, Digital, Line Graph
Units: Hertz
Instances: 253
9.6.3 AC Utility
9.6.3.1 Average Current
Displays the average RMS electrical current being sourced from an AC Utility on all phases.
Component Types: Gauge, Status Bars, Digital, Line Graph
Instances: 253
Units: Amperes
9.6.3.2 Average Frequency
Displays the average frequency of an AC Utility on all phases.
Component Types: Gauge, Status Bars, Digital, Line Graph
Units: Hertz
Instances: 253
9.6.3.3 Average Line-Line Voltage
Displays the average line to line RMS voltage of an AC Utility on all phases.
Component Types: Gauge, Status Bars, Digital, Line Graph
Units: Hertz
Instances: 253
9.6.3.4 Average Line-Neutral Voltage
Displays the average line to neutral RMS voltage of an AC Utility on all phases.
Component Types: Gauge, Status Bars, Digital, Line Graph
Units: Hertz
Instances: 253
9.6.3.5 AC Utility Phase A Apparent Power
Displays the Apparent Power being drawn on Phase A from an AC Utility
Component Types: Gauge, Status Bars, Digital, Line Graph
Instances: 253
Units: VA
9.6.3.6 Phase A Current
Displays the RMS electrical current being sourced from an AC Utility on phase A.
Component Types: Gauge, Status Bars, Digital, Line Graph
Instances: 253
Units: Amperes
9.6.3.7 Phase A Frequency
Displays the frequency of an AC Utility on phase A.
Component Types: Gauge, Status Bars, Digital, Line Graph
Units: Hertz
Instances: 253
9.6.3.8 Phase A Line-Neutral Voltage
Displays the phase A to neutral RMS voltage of an AC Utility.
Component Types: Gauge, Status Bars, Digital, Line Graph
Units: Hertz
Instances: 253
9.6.3.9 Phase A Power Factor
Displays the Power Factor of phase A of an AC Utility.
Component Types: Digital
Units: %
Instances: 253
9.6.3.10 Phase A Reactive Power
Displays the Reactive Power being drawn on Phase A from an AC Utility.
Component Types: Gauge, Status Bars, Digital, Line Graph
Instances: 253
Units: VAr
9.6.3.11 Phase A Real Power
Displays the Real Power being drawn on Phase A from an AC Utility.
Component Types: Gauge, Status Bars, Digital, Line Graph
Instances: 253
Units: Watts / kilowatts
9.6.3.12 Phase AB Line-Line Voltage
Displays the voltage between Phase A and Phase B of an AC Utility.
Component Types: Gauge, Status Bars, Digital, Line Graph
Units: Hertz
Instances: 253
9.6.3.13 Phase B Apparent Power
Displays the Apparent Power being drawn on Phase B from an AC Utility
Component Types: Gauge, Status Bars, Digital, Line Graph
Instances: 253
Units: VA
9.6.3.14 Phase B Current
Displays the RMS electrical current being sourced from an AC Utility on phase B.
Component Types: Gauge, Status Bars, Digital, Line Graph
Instances: 253
Units: Amperes
9.6.3.15 Phase B Frequency
Displays the frequency of an AC Utility on phase B.
Component Types: Gauge, Status Bars, Digital, Line Graph
Units: Hertz
Instances: 253
9.6.3.16 Phase B Line-Neutral Voltage
Displays the phase B to neutral RMS voltage of an AC Utility.
Component Types: Gauge, Status Bars, Digital, Line Graph
Units: Hertz
Instances: 253
9.6.3.17 Phase B Power Factor
Displays the Power Factor of phase B of an AC Utility.
Component Types: Digital
Units: %
Instances: 253
9.6.3.18 Phase B Reactive Power
Displays the Reactive Power being drawn on Phase B from an AC Utility.
Component Types: Gauge, Status Bars, Digital, Line Graph
Instances: 253
Units: VAr
9.6.3.19 Phase B Real Power
Displays the Real Power being drawn on Phase B from an AC Utility.
Component Types: Gauge, Status Bars, Digital, Line Graph
Instances: 253
Units: Watts / kilowatts
9.6.3.20 Phase BC Line-Line Voltage
Displays the voltage between Phase B and Phase C of an AC Utility.
Component Types: Gauge, Status Bars, Digital, Line Graph
Units: Hertz
Instances: 253
9.6.3.21 Phase C Apparent Power
Displays the Apparent Power being drawn on Phase A from an AC Utility
Component Types: Gauge, Status Bars, Digital, Line Graph
Instances: 253
Units: VA
9.6.3.22 Phase C Current
Displays the RMS electrical current being sourced from an AC Utility on phase C.
Component Types: Gauge, Status Bars, Digital, Line Graph
Instances: 253
Units: Amperes
9.6.3.23 Phase C Frequency
Displays the frequency of an AC Utility on phase C.
Component Types: Gauge, Status Bars, Digital, Line Graph
Units: Hertz
Instances: 253
9.6.3.24 Phase C Line-Neutral Voltage
Displays the phase C to neutral RMS voltage of an AC Utility.
Component Types: Gauge, Status Bars, Digital, Line Graph
Units: Hertz
Instances: 253
9.6.3.25 Phase C Power Factor
Displays the Power Factor of phase C of an AC Utility.
Component Types: Digital
Units: %
Instances: 253
9.6.3.26 Phase C Reactive Power
Displays the Reactive Power being drawn on Phase C from an AC Utility.
Component Types: Gauge, Status Bars, Digital, Line Graph
Instances: 253
Units: VAr
9.6.3.27 Phase C Real Power
Displays the Real Power being drawn on Phase C from an AC Utility.
Component Types: Gauge, Status Bars, Digital, Line Graph
Instances: 253
Units: Watts / kilowatts
9.6.3.28 Phase CA Line-Line Voltage
Displays the voltage between Phase C and Phase A of an AC Utility.
Component Types: Gauge, Status Bars, Digital, Line Graph
Units: Hertz
Instances: 253
9.6.3.29 Total Apparent Power
Displays the Total Apparent Power being drawn on all phases from an AC Utility
Component Types: Gauge, Status Bars, Digital, Line Graph
Instances: 253
Units: VA
9.6.3.30 Total Power Factor
Displays the Total Power Factor of all phases of an AC Utility.
Component Types: Digital
Units: %
Instances: 253
9.6.3.31 Total Reactive Power
Displays the Total Reactive Power being drawn on all phases from an AC Utility.
Component Types: Gauge, Status Bars, Digital, Line Graph
Instances: 253
Units: VAr
9.6.3.32 Total Real Power
Displays the Total Real Power being drawn on all phases from an AC Utility.
Component Types: Gauge, Status Bars, Digital, Line Graph
Instances: 253
Units: Watts / kilowatts
9.6.3.33 Total kWh Export
Displays the Total kilowatt-Hours exported to an AC Utility.
Component Types: Digital
Instances: 253
Units: kilowatt-hours
9.6.3.34 Total kWh Import
Displays the Total kilowatt-Hours imported from an AC Utility.
Component Types: Digital
Instances: 253
Units: kilowatt-hours
9.6.4 Active Buttons
9.6.4.1 Connect N2K
When this button is pressed, the software tries to connect to a IPG100 or N2KServer running on a PC.
9.6.4.2 Contract Graphs
When this button is pressed all the graphs on the page will change their horizontal axis timescales to the next smaller value.
9.6.4.3 Expand Graphs
When this button is pressed all the graphs on the page will change their horizontal axis timescales to the next larger value.
9.6.4.4 Print Screen
When this button is pressed a copy of the screen contents is saved in the documents directory, or directly to a USB drive.
9.6.4.5 Reset All Counters
When this button is pressed all the counters on the page will be reset to zero.
9.6.4.6 Reset All Timers
When this button is pressed all the timers on the page will be reset to zero.
9.6.4.7 Screen Select
Having this button on one screen allows the user to jump directly to another screen or open a dialog without showing the tabs.
Screen Select has the following options for Button Type:
· Screen Select - The Alerts Screen or any User-defined screen
· Back – the previously viewed screen
· Home – a direct jump to the first screen with “home” in its name.
· Vessel Mode – a direct jump to the first screen with the Vessel Operating Mode in its name.
· Power – Opens the Power Management Sub-menu (9.4.8)
· Breaker Lockout dialog – Opens the Breaker Lockout dialog (9.4.8.1) for the page on which the Screen Select button is located
· Breaker Status dialog – Opens the Breaker Status dialog (9.4.8.2) for the page on which the Screen Select button is located
· About – Opens the About dialog (9.4.1)
· Clean Screen – Opens the Clean Screen dialog (9.4.5)
· General Configuration – Opens the General Configuration dialog (9.4.6.1)
· Operating Mode – Opens the Operating Mode dialog (10.4.5)
9.6.4.8 Set Mode to Anchored
When this button is pressed the Vessel Operating Mode is changed to Anchored.
9.6.4.9 Set Mode to Disabled
When this button is pressed the Vessel Operating Mode is changed to Disabled.
9.6.4.10 Set Mode to Moored
When this button is pressed the Vessel Operating Mode is changed to Moored.
9.6.4.11 Set Mode to Underway
When this button is pressed the Vessel Operating Mode is changed to Underway.
9.6.4.12 Set Mode to User 1
When this button is pressed the Vessel Operating Mode is changed to User 1.
9.6.4.13 Set Mode to User 2
When this button is pressed the Vessel Operating Mode is changed to User 2.
9.6.4.14 Show Tabs
When this button is pressed the tabs will be displayed.
9.6.4.15 Toggle Day/Night Mode
When this button is pressed the screen mode switches between Day Mode and Night Mode.
9.6.5 Air Conditioning / Heating
9.6.5.1 E
This displays the parameters from a MarineAir Systems Elite Air Conditioner. With the licensing of the Control Module, the Air Conditioner may be controlled remotely.
Component Types: Air Conditioner
Instances: 253
This would be the instance of the J2K100 bridge to which the Air Controller is connected.
Units: not applicable
9.6.5.2 Q
This displays the parameters from a CruisAir Systems Q-Logic Air Conditioner. With the licensing of the Control Module, the Air Conditioner may be controlled remotely.
Component Types: Air Conditioner
Instances: 253
Units: not applicable
9.6.6 Anchor
Please see the section on Anchoring for a full explanation of how these parameters interact (section 13.1).
9.6.6.1 Anchor Scope at High Tide
This displays the calculated worst case Anchor Scope as a ratio (e.g. 4:1) at high tide, based on the Anchor Depth, Tide Rise, and Rode deployed.
Component Types: Digital
Units: ratio (n:1)
Instances: not applicable
9.6.6.2 Anchor Depth
This displays the depth of water recorded when the Anchor was dropped. It should correspond to the depth of the anchor at the tide when the anchor was dropped. The value may be changed by the user from the Control if a Digital Input control is used.
Component Types: Digital, Digital Input
Units: Feet, Yards, Fathoms, Meters
Instances: not applicable
9.6.6.3 Anchor Distance to GPS
This displays the calculated distance from the GPS to the anchor. If the anchor has not been dropped, it will show the distance from the hawsepipe to the GPS.
Component Types: Digital, Line Graph
Units: Feet, Yards, Fathoms, Meters
Instances: not applicable
9.6.6.4 Anchor Distance to Hawsepipe
This displays the calculated distance from the hawsepipe to the anchor. If the anchor has not been dropped, it will show the zero.
Component Types: Digital, Line Graph
Units: Feet, Yards, Fathoms, Meters
Instances: not applicable
9.6.6.5 Anchor Drag Radius
This is the maximum distance from the dropped Anchor position to the GPS that is possible without the anchor dragging. This is maximized at low tide so the predicted tide drop is taken into account when calculating this radius.
Component Types: Digital
Units: Feet, Yards, Fathoms, Meters
Instances: not applicable
9.6.6.6 Anchor Drop Date / Time
The date and time at which the anchor was dropped.
Component Types: Digital
Units: Different Date and Time formats
Instances: not applicable
9.6.6.7 Anchor Lat/Long
The position recorded when the anchor was dropped. If the anchor drags, the position may be changed by pressing the Reset Anchor button
Component Types: Digital
Units: Different Position formats
Instances: not applicable
9.6.6.8 Anchor Rode
The amount of rode deployed. Normally this is set by the user based on the values displayed on the Rode Counter. The Minimum Required Anchor Rode is calculated by the software, and on pressing the Drop Anchor button, this value will be transferred to the Anchor Rode control as an initial value. It is important that this initial value is corrected by the user when the actual value is known.
When the Anchor Rode is obtained over the NMEA 2000 bus directly from the Windlass, this parameter will reflect the value from the Windlass. It may be reset to zero.
Component Types: Digital, Digital Input
Units: Feet, Yards, Fathoms, Meters
Instances: Instance number of the Windlass
9.6.6.9 Anchor Set Radius
This is the maximum distance from the dropped Anchor position to the Hawsepipe that is possible without the anchor dragging at the time of anchoring. The predicted tide drop is NOT taken into account when calculating this radius. The value will not be displayed one hour after the anchor is dropped.
Component Types: Digital
Units: Feet, Yards, Fathoms, Meters
Instances: not applicable
9.6.6.10 Anchor Watch
The Anchor Watch Parameter is a complex view into the Anchoring Module (see 13).
Component Types: Anchor Watch
Units: not applicable
Instances: not applicable
9.6.6.11 Anchor Watch Alert Radius
This displays the radius of the first Anchor Watch Alert in the system. This is the Anchor Watch Alert with the highest priority (i.e. the lowest Priority number). The radius of the alert is the trigger point for the alert, and may be changed by the user from this control.
Component Types: Digital, Digital Input
Units: Feet, Yards, Fathoms, Meters
Instances: not applicable
9.6.6.12 Clear Anchor Button
This is an Active Button. It will be active when the Anchor is dropped, and on pressing the button the Anchoring Module will assume that the anchor is no longer on the seabed.
Component Types: Active Button
Units: not applicable
Instances: not applicable
9.6.6.13 Distance Beyond Anchor Drag Radius
This is the difference between the Anchor Drag Radius and the Anchor Distance to GPS, with negative values showing that the boat is within the Drag Radius and positive values showing that the boat is outside the Drag Radius – the anchor is being dragged.
Component Types: Digital
Units: Feet, Yards, Fathoms, Meters
Instances: not applicable
9.6.6.14 Distance Beyond Anchor Set Radius
This is the difference between the Anchor Set Radius and the Anchor Distance to Hawsepipe, with negative values showing that the boat is within the Set Radius and positive values showing that the boat is outside the Set Radius – the anchor is being dragged. The display will be disabled one hour after the anchor is dropped.
Component Types: Digital
Units: Feet, Yards, Fathoms, Meters
Instances: not applicable
9.6.6.15 Drop Anchor Button
This is an Active Button. It will be active when the Anchor is not dropped, and on pressing the button the Anchoring Module assume that the anchor is on the seabed.
Component Types: Active Button
Units: not applicable
Instances: not applicable
9.6.6.16 Min Required Anchor Scope
This displays the required minimum value of Anchor Scope. It is set by the user based on anchor type and bottom type as a ratio (e.g. 4:1).
Component Types: Digital, Digital Input
Units: ratio (n:1)
Instances: not applicable
9.6.6.17 Minimum Anchor Rode
The minimum amount of rode that must be deployed to achieve the Min Required Anchor Scope at high tide. This is calculated by N2KView from the Anchor Depth, Tide Ride and Min Required Anchor Scope. The Minimum Set Radius is based on this parameter.
Component Types: Digital
Units: Feet, Yards, Fathoms, Meters
Instances: not applicable
9.6.6.18 Reset Anchor Button
This is an Active Button. It will be active when the Anchor is dropped, and the boats heading shows the Dropped Anchor position directly ahead. The button should be pressed after the anchor has dragged and has been set at a different position to where is was dropped, and the boat is pulling back on the rode such that the rode is taught. When the button is pressed the new position of the anchor is calculated and updated.
Component Types: Active Button
Units: not applicable
Instances: not applicable
9.6.6.19 Tide Drop
This displays the value of the predicted Tide Drop from the time of anchoring to low tide. The value must be entered by the user prior to dropping the anchor, and may be changed by the user from this control.
Component Types: Digital, Digital Input
Units: Feet, Yards, Fathoms, Meters
Instances: not applicable
9.6.6.20 Tide Rise
This displays the value of the predicted Tide Rise from the time of anchoring to high tide. The value must be entered by the user prior to dropping the anchor, and may be changed by the user from this control.
Component Types: Digital, Digital Input
Units: Feet, Yards, Fathoms, Meters
Instances: not applicable
9.6.6.21 Vessel Swing Circle Radius
This is the maximum distance from the dropped Anchor position to the stern of the boat that is possible without the anchor dragging. This is maximized at low tide so the predicted tide drop is taken into account when calculating this radius.
Component Types: Digital
Units: Feet, Yards, Fathoms, Meters
Instances: not applicable
9.6.6.22 Windlass Down Button
This is an Active Button. If the boat is fitted with an NMEA 2000 equipped Windlass capable of responding to NMEA 2000 commands, this button can be used to command the windlass to start paying out rode. After the windlass starts, N2KView will automatically press Anchor Down button when the deployed rode matches the depth plus the hawsepipe height.
Component Types: Active Button
Units: not applicable
Instances: Instance Number of the Windlass
9.6.6.23 Windlass Stop Button
This is an Active Button. If the boat is fitted with an NMEA 2000 equipped Windlass capable of responding to NMEA 2000 commands, this button can be used to command the windlass to stop paying out rode.
Component Types: Active Button
Units: not applicable
Instances: Instance Number of the Windlass
9.6.6.24 Windlass Up Button
This is an Active Button. If the boat is fitted with an NMEA 2000 equipped Windlass capable of responding to NMEA 2000 commands, this button can be used to command the windlass to start paying out rode. After the windlass starts, N2KView will automatically simulate the pressing of the Anchor Clear button when the deployed rode reaches zero.
Component Types: Active Button
Units: not applicable
Instances: Instance Number of the Windlass
9.6.7 BNWAS (Bridge Navigation Watch Alarm System)
9.6.7.1 BNWAS
This component displays the current state of the BNWAS System. The time remaining in the current state will also be displayed. The display flashes Yellow in the Bridge Visual state and Flashes Red in all the audible Alarm states.
See section 11 for more detail.
9.6.8 DC
9.6.8.1 Battery AH Remaining
Displays the estimated Amp Hours that are remaining in the battery
Component Types: Gauge, Status Bars, Bar Graph, Digital, Line Graph
Units: Ah
Instances: 253
9.6.8.2 Battery State of Charge
Displays the current energy in the battery as a percentage of its total capacity.
Component Types: Gauge, Status Bars, Bar Graph, Digital, Line Graph
Units: %
Instances: 253
9.6.8.3 Battery State of Health
Displays the state of health of the battery as a percentage of its initial state of health .
Component Types: Gauge, Status Bars, Bar Graph, Digital, Line Graph
Units: %
Instances: 253
9.6.8.4 Battery Temperature
Displays the battery case temperature
Component Types: Gauge, Status Bars, Bar Graph, Digital, Line Graph
Units: Degrees Centigrade, Degrees Fahrenheit
Instances: 253
9.6.8.5 Battery Time Remaining
Displays the time remaining that the battery can continue to operate at its current load
Component Types: Gauge, Status Bars, Bar Graph, Digital, Line Graph
Units: Hours and Minutes
Instances: 253
9.6.8.6 Current
Displays the electrical current being sourced to/from the battery
Component Types: Gauge, Status Bars, Bar Graph, Digital, Line Graph
Units: Amperes
Instances: 253
9.6.8.7 Power
Displays the DC power currently being provided by the battery
Component Types: Gauge, Status Bars, Bar Graph, Digital, Line Graph
Units: Watts / kilowatts
Instances: 16
9.6.8.8 Voltage
Displays the voltage measured at the battery
Component Types: Gauge, Status Bars, Digital, Line Graph
Units: Volts
Instances: 253
9.6.8.9 Ripple Voltage
Displays the ripple voltage measured at the battery.
Component Types: Gauge, Status Bars, Digital, Line Graph
Units: Volts
Instances: 253
9.6.8.10 Total Current
Displays the sum of a number of DC currents.
Component Types: Gauge, Status Bars, Digital, Line Graph
Units: Volts
Instances: multiple, entered as a comma separated list
9.6.9 Depth
9.6.9.1 Transducer Offset
Displays the offset being used by a depth transducer. Positive values represent distance from transducer to water line and negative values represent distance from the transducer to the keel.
Component Types: Digital
Units: feet, yards, fathoms, meters
Instances: 253
9.6.9.2 Water Below Transducer
Displays the current reading from a depth transducer.
Component Types: Digital, Depth Graph
Units: feet, yards, fathoms, meters
Instances: 253
9.6.9.3 Water Depth (includes offset)
Displays the current reading from a depth transducer plus the Transducer offset.
Component Types: Digital, Line Graph
Units: feet, yards, fathoms, meters
Instances: 253
9.6.10 Electrical
9.6.10.1 Resistance
A 4-20mA current loop strain transducer may be connected to Maretron’s CLM100 to measure resistance
Component Types: Bar Graph, Gauge, Status Bars, Digital, Line Graph
Units: Ohms, kiloOhms
Instances: 253
9.6.11 Electrical Distribution
9.6.11.1 Switch/Circuit Breaker
Displays whether the specified circuit breaker is open, closed, or tripped. If the circuit breaker panel supports remote switching, then you will able to turn the breaker On and Off by clicking on the component. If the breaker has been tripped, you can reset it by turning it Off and then back On.
Component Types: Circuit Breaker / Switch, Push Buttons, Digital Counter, Digital Timer, Indicator Graph
Instances: 253
Switches (Per Instance): up to 28
9.6.11.2 Hardware Counter
Maretron’s DCR100, SIM100 and RIM100 will count switch operations. This parameter displays the value of the count stored in the device. A reset button allows the count to be reset. Separate counters are maintained for On count, Off count and Error count. All are reset simultaneously.
Component Types: Digital Counter
Instances: 253
Switches (Per Instance): 28
9.6.11.3 Hardware Timer
Maretron’s DCR100, SIM100 and RIM100 will time switch operations. This parameter displays the value of the time stored in the device. A reset button allows the timer to be reset. Separate timers are maintained for On time, Off time and Error time. All are reset simultaneously.
Component Types: Digital Timer
Instances: 253
Switches (Per Instance): 28
9.6.11.4 Dimmer
For those units that support PWM dimming such as Maretron’s CLMD12 and CLMD16, these parameters display and control the current PWM percentage.
Component Types: Digital Timer
Instances: 253
Dimmers (Per Instance): 28
9.6.11.5 Phase A AC Current
For AC Breaker boxes that are capable of supplying Phase information, this parameter displays the value of the current flowing in the phase.
Component Types: Gauge, Status Bars, Bar Graph, Digital, Line Graph
Units: Amps
Instances: 253
Switches (Per Instance): 28
9.6.11.6 Phase A AC Frequency
For AC Breaker boxes that are capable of supplying Phase information, this parameter displays the value of the frequency of the phase.
Component Types: Gauge, Status Bars, Bar Graph, Digital, Line Graph
Units: Hz
Instances: 253
Switches (Per Instance): 28
9.6.11.7 Phase A L-N AC Voltage
For AC Breaker boxes that are capable of supplying Phase information, this parameter displays the value of the voltage of the phase, relative to neutral.
Component Types: Gauge, Status Bars, Bar Graph, Digital, Line Graph
Units: Volts
Instances: 253
Switches (Per Instance): 28
9.6.11.8 Phase A Real AC Power
For AC Breaker boxes that are capable of supplying Phase information, this parameter displays the value of the power drawn by the phase.
Component Types: Gauge, Status Bars, Bar Graph, Digital, Line Graph
Units: Kilowatts, Watts
Instances: 253
Switches (Per Instance): 28
9.6.11.9 Phase AB L-L AC Voltage
For AC Breaker boxes that are capable of supplying Phase information, this parameter displays the value of the voltage between phases A and B.
Component Types: Gauge, Status Bars, Bar Graph, Digital, Line Graph
Units: Volts
Instances: 253
Switches (Per Instance): 28
9.6.11.10 Phase B AC Current
For AC Breaker boxes that are capable of supplying Phase information, this parameter displays the value of the current flowing in the phase.
Component Types: Gauge, Status Bars, Bar Graph, Digital, Line Graph
Units: Amps
Instances: 253
Switches (Per Instance): 28
9.6.11.11 Phase B AC Frequency
For AC Breaker boxes that are capable of supplying Phase information, this parameter displays the value of the frequency of the phase.
Component Types: Gauge, Status Bars, Bar Graph, Digital, Line Graph
Units: Hz
Instances: 253
Switches (Per Instance): 28
9.6.11.12 Phase B L-N AC Voltage
For AC Breaker boxes that are capable of supplying Phase information, this parameter displays the value of the voltage of the phase, relative to neutral.
Component Types: Gauge, Status Bars, Bar Graph, Digital, Line Graph
Units: Volts
Instances: 253
Switches (Per Instance): 28
9.6.11.13 Phase B Real AC Power
For AC Breaker boxes that are capable of supplying Phase information, this parameter displays the value of the power drawn by the phase.
Component Types: Gauge, Status Bars, Bar Graph, Digital, Line Graph
Units: Kilowatts, Watts
Instances: 253
Switches (Per Instance): 28
9.6.11.14 Phase BC L-L AC Voltage
For AC Breaker boxes that are capable of supplying Phase information, this parameter displays the value of the voltage between phases B and C.
Component Types: Gauge, Status Bars, Bar Graph, Digital, Line Graph
Units: Volts
Instances: 253
Switches (Per Instance): 28
9.6.11.15 Phase C AC Current
For AC Breaker boxes that are capable of supplying Phase information, this parameter displays the value of the current flowing in the phase.
Component Types: Gauge, Status Bars, Bar Graph, Digital, Line Graph
Units: Amps
Instances: 253
Switches (Per Instance): 28
9.6.11.16 Phase C AC Frequency
For AC Breaker boxes that are capable of supplying Phase information, this parameter displays the value of the frequency of the phase.
Component Types: Gauge, Status Bars, Bar Graph, Digital, Line Graph
Units: Hz
Instances: 253
Switches (Per Instance): 28
9.6.11.17 Phase C L-N AC Voltage
For AC Breaker boxes that are capable of supplying Phase information, this parameter displays the value of the voltage of the phase, relative to neutral.
Component Types: Gauge, Status Bars, Bar Graph, Digital, Line Graph
Units: Volts
Instances: 253
Switches (Per Instance): 28
9.6.11.18 Phase C Real AC Power
For AC Breaker boxes that are capable of supplying Phase information, this parameter displays the value of the power drawn by the phase.
Component Types: Gauge, Status Bars, Bar Graph, Digital, Line Graph
Units: Kilowatts, Watts
Instances: 253
Switches (Per Instance): 28
9.6.11.19 Phase CA L-L AC Voltage
For AC Breaker boxes that are capable of supplying Phase information, this parameter displays the value of the voltage between phases C and A.
Component Types: Gauge, Status Bars, Bar Graph, Digital, Line Graph
Units: Volts
Instances: 253
Switches (Per Instance): 28
9.6.11.20 Switch/Breaker Current
Maretron’s DCR100, CLMD12, CLMD16 and Carling’s DC Switches measure the current flowing through a switch. This parameter displays that current.
Component Types: Circuit Breaker / Switch
Units: Amps
Instances: 253
Switches (Per Instance): 28
9.6.11.21 Switch/Breaker Group
Displays the status of a Switch/Breaker Group defined locally in this N2KView. The status is considered “ON’ when all the breakers specified in the group are in the state desired by the group. Pressing the momentary switch, will command all the breakers in the group to their desired state. When all those requests have been satisfied and the switches report their states back to N2KView, then the control will move to the ON position. As soon as any switch in the group moves away from its desired state, the switch moves to the OFF position.
Component Types: Buttons, Circuit Breaker / Switch (momentary only)
Instances: 253
Switches (Per Instance): 28
9.6.11.22 Switch/Breaker Voltage
Maretron’s CLMD12 and CLMD16 measure the voltage supplied to a switch. This parameter displays that voltage.
Component Types: Circuit Breaker / Switch
Units: Amps
Instances: 253
Switches (Per Instance): 28
9.6.12 Engine
9.6.12.1 Engine Boost Pressure
Displays the boost pressure of a supercharger or turbocharger.
Component Types: Gauge, Status Bars, Bar Graph, Digital, Line Graph
Units: kilopascals, bars, pounds/square inch
Instances: 253
9.6.12.2 Engine Coolant Pressure
Displays the engine’s water or coolant pressure
Component Types: Gauge, Status Bars, Bar Graph, Digital, Line Graph
Units: kilopascals, bars, pounds/square inch
Instances: 253
9.6.12.3 Engine Coolant Temperature
Displays the engine’s water or coolant temperature
Component Types: Gauge, Status Bars, Bar Graph, Digital, Line Graph
Units: Degrees Centigrade, Degrees Fahrenheit
Instances: 253
9.6.12.4 Engine Fuel Pressure
Displays the pressure of the fuel for the engine.
Component Types: Gauge, Status Bars, Bar Graph, Digital, Line Graph
Units: kilopascals, bars, pounds/square inch
Instances: 253
9.6.12.5 Engine Oil Pressure
Displays the engine’s oil pressure.
Component Types: Gauge, Status Bars, Bar Graph, Digital, Line Graph
Units: kilopascals, bars, pounds/square inch
Instances: 253
9.6.12.6 Engine Oil Temperature
Displays the engine’s oil temperature.
Component Types: Gauge, Status Bars, Bar Graph, Digital, Line Graph
Units: Degrees Centigrade, Degrees Fahrenheit
Instances: 253
9.6.12.7 Exhaust Gas Temperature
Displays the temperature of the engine’s exhaust gases.
Component Types: Gauge, Status Bars, Bar Graph, Digital, Line Graph
Units: Degrees Centigrade, Degrees Fahrenheit
Instances: 253
9.6.12.8 Fuel Consumption
Displays the engine’s fuel usage (volume / distance). This is the inverse of fuel economy.
Component Types: Gauge, Status Bars, Bar Graph, Digital, Line Graph
Units: imp gals/kilometer, liters/kilometer, gals/kilometer, imp gals/nautical mile, liters/nautical mile, gals/nautical mile, imp gals/statute mile, liters/statute mile, gals/statute mile
Instances: 253
9.6.12.9 Fuel Economy
Displays the engine’s fuel usage (distance / volume)
Component Types: Gauge, Status Bars, Bar Graph, Digital, Line Graph
Units: kilometers/imp gal, kilometers/liter, kilometers/gal, nautical miles/imp gal, nautical miles/liter, nautical miles/gal, statute miles/imp gal, statute miles/liter, statute miles/gal
Instances: 253
9.6.12.10 Fuel Rate
Displays the rate of fuel consumption for the engine
Component Types: Gauge, Status Bars, Bar Graph, Digital, Line Graph
Units: imp gal/hr, Liter/hr, gal/hr
Instances: 253
9.6.12.11 Hours
Displays the number of hours of operation reported by the engine
Component Types: Digital
Units: Hours
Instances: 253
9.6.12.12 Percent Load
Displays the current load on the engine as a percentage of its rated load
Component Types: Gauge, Status Bars, Bar Graph, Digital, Line Graph
Units: percent
Instances: 253
9.6.12.13 Percent Torque
Displays the current torque being provided by the engine as a percentage of its rated torque
Component Types: Gauge, Status Bars, Bar Graph, Digital, Line Graph
Units: percent
Instances: 253
9.6.12.14 Tachometer
Displays the rotational speed of the engine.
Component Types: Gauge, Status Bars, Bar Graph, Digital, Line Graph
Units: revolutions/minute
Instances: 253
9.6.12.15 Tilt/Trim
Displays the tilt or trim of the drive
Component Types: Gauge, Status Bars, Bar Graph, Digital, Line Graph
Units: percent
Instances: 253
9.6.12.16 Voltage
Displays the electrical power supply voltage measured at the engine
Component Types: Gauge, Status Bars, Bar Graph, Digital, Line Graph
Units: Volts
Instances: 253
9.6.13 Engine Warning
9.6.13.1 Charge
Generally indicates a fault in the engine’s charging system. Please consult the engine manufacturer’s documentation for details.
Component Types: Indicator Light / Small Indicator Light / Digital Counter / Timer / Indicator Graph
Instances: 253
9.6.13.2 Check Engine
Generally indicates some condition in the engine that requires investigation. Please consult the engine manufacturer’s documentation for details.
Component Types: Indicator Light / Small Indicator Light / Digital Counter / Timer / Indicator Graph
Instances: 253
9.6.13.3 Comm Error
Generally indicates some condition relative to engine communications that requires investigation. Please consult the engine manufacturer’s documentation for details.
Component Types: Indicator Light / Small Indicator Light / Digital Counter / Timer / Indicator Graph
Instances: 253
9.6.13.4 Cranking
Generally indicates that the starter on the engine is engaged. Please consult the engine manufacturer’s documentation for details.
Component Types: Indicator Light / Small Indicator Light / Digital Counter / Timer / Indicator Graph
Instances: 253
9.6.13.5 EGR System
Generally indicates a fault in the exhaust gas recirculation (EGR) system. Please consult the engine manufacturer’s documentation for details.
Component Types: Indicator Light / Small Indicator Light / Digital Counter / Timer / Indicator Graph
Instances: 253
9.6.13.6 Emergency Stop
Generally indicates that the engine was stopped using an emergency stop button. Please consult the engine manufacturer’s documentation for details.
Component Types: Indicator Light / Small Indicator Light / Digital Counter / Timer / Indicator Graph
Instances: 253
9.6.13.7 High Boost
Generally indicates that the supercharger/turbocharger boost pressure has exceeded some engine-defined limit. Please consult the engine manufacturer’s documentation for details.
Component Types: Indicator Light / Small Indicator Light / Digital Counter / Timer / Indicator Graph
Instances: 253
9.6.13.8 Low Coolant Level
Generally indicates that the level of coolant has fallen below some engine-defined limit. Please consult the engine manufacturer’s documentation for details.
Component Types: Indicator Light / Small Indicator Light / Digital Counter / Timer / Indicator Graph
Instances: 253
9.6.13.9 Low Fuel Pressure
Generally indicates that the fuel pressure has fallen below some engine-defined limit. Please consult the engine manufacturer’s documentation for details.
Component Types: Indicator Light / Small Indicator Light / Digital Counter / Timer / Indicator Graph
Instances: 253
9.6.13.10 Low Oil Level
Generally indicates that the oil level has fallen below some user-defined limit. Please consult the engine manufacturer’s documentation for details.
Component Types: Indicator Light / Small Indicator Light / Digital Counter / Timer / Indicator Graph
Instances: 253
9.6.13.11 Low Oil Pressure
Generally indicates that the oil pressure has fallen below some user-defined limit. Please consult the engine manufacturer’s documentation for details.
Component Types: Indicator Light / Small Indicator Light / Digital Counter / Timer / Indicator Graph
Instances: 253
9.6.13.12 Low System Voltage
Generally indicates that the system voltage has fallen below some user-defined limit. Please consult the engine manufacturer’s documentation for details.
Component Types: Indicator Light / Small Indicator Light / Digital Counter / Timer / Indicator Graph
Instances: 253
9.6.13.13 Maintenance Needed
Generally indicates that the engine is in need of maintenance. Please consult the engine manufacturer’s documentation for details.
Component Types: Indicator Light / Small Indicator Light / Digital Counter / Timer / Indicator Graph
Instances: 253
9.6.13.14 Neutral Start Protect
Generally indicates that the engine will not start because the transmission is not in neutral. Please consult the engine manufacturer’s documentation for details.
Component Types: Indicator Light / Small Indicator Light / Digital Counter / Timer / Indicator Graph
Instances: 253
9.6.13.15 Over Temperature
Generally indicates that the engine’s temperature has exceeded some engine-defined limit. Please consult the engine manufacturer’s documentation for details.
Component Types: Indicator Light / Small Indicator Light / Digital Counter / Timer / Indicator Graph
Instances: 253
9.6.13.16 Power Reduction
Generally indicates that the engine is operating in a reduced-power mode due to some fault condition. Please consult the engine manufacturer’s documentation for details.
Component Types: Indicator Light / Small Indicator Light / Digital Counter / Timer / Indicator Graph
Instances: 253
9.6.13.17 Preheat
Generally indicates that the cylinder preheaters are active. Please consult the engine manufacturer’s documentation for details.
Component Types: Indicator Light / Small Indicator Light / Digital Counter / Timer / Indicator Graph
Instances: 253
9.6.13.18 Rev Limit Exceeded
Generally indicates that the engine’s RPM has exceeded some engine-defined limit. Please consult the engine manufacturer’s documentation for details.
Component Types: Indicator Light / Small Indicator Light / Digital Counter / Timer / Indicator Graph
Instances: 253
9.6.13.19 Shutting Down
Generally indicates that the engine is in the process of shutting down. Please consult the engine manufacturer’s documentation for details.
Component Types: Indicator Light / Small Indicator Light / Digital Counter / Timer / Indicator Graph
Instances: 253
9.6.13.20 Sub/Secondary Throttle
Generally indicates that the engine has fallen back to a secondary throttle due to some fault detected in the primary throttle. Please consult the engine manufacturer’s documentation for details.
Component Types: Indicator Light / Small Indicator Light / Digital Counter / Timer / Indicator Graph
Instances: 253
9.6.13.21 Throttle Position Sensor
Generally indicates a fault in the throttle position sensor. Please consult the engine manufacturer’s documentation for details.
Component Types: Indicator Light / Small Indicator Light / Digital Counter / Timer / Indicator Graph
Instances: 253
9.6.13.22 Warning Level 1
Generally indicates some engine-specific warning condition. Please consult the engine manufacturer’s documentation for details.
Component Types: Indicator Light / Small Indicator Light / Digital Counter / Timer / Indicator Graph
Instances: 253
9.6.13.23 Warning Level 2
Generally indicates some engine-specific warning condition. Please consult the engine manufacturer’s documentation for details.
Component Types: Indicator Light / Small Indicator Light / Digital Counter / Timer / Indicator Graph
Instances: 253
9.6.13.24 Water Flow
Generally indicates a lack of water flow in cooling system. Please consult the engine manufacturer’s documentation for details.
Component Types: Indicator Light / Small Indicator Light / Digital Counter / Timer / Indicator Graph
Instances: 253
9.6.13.25 Water In Fuel
Generally indicates that water has been detected in the engine’s fuel. Please consult the engine manufacturer’s documentation for details.
Component Types: Indicator Light / Small Indicator Light / Digital Counter / Timer / Indicator Graph
Instances: 253
9.6.14 Environment
9.6.14.1 Bait Well Temperature
Displays the temperature from a temperature sensor set up with a source of “Bait Well”.
Component Types: Gauge, Status Bars, Bar Graph, Digital, Line Graph
Units: degrees Centigrade, degrees Fahrenheit
Instances: 253
9.6.14.2 Barometric Pressure
Displays the atmospheric (barometric) pressure
Component Types: Bar Graph, Line Graph, Digital
Units: bars, millibars, inches mercury, kilopascals, millimeters mercury
Instances: 253
9.6.14.3 Dew Point
Displays the current dew point based on air temperature and humidity
Component Types: Bar Graph, Digital, Line Graph
Units: degrees Centigrade, degrees Fahrenheit
9.6.14.4 Engine Room Temperature
Displays the temperature from a temperature sensor set up with a source of “Engine Room”.
Component Types: Gauge, Status Bars, Bar Graph, Digital, Line Graph
Units: degrees Centigrade, degrees Fahrenheit
Instances: 253
9.6.14.5 Heat Index
Displays the current heat index based on air temperature and humidity
Component Types: Bar Graph, Digital, Line Graph
Units: degrees Centigrade, degrees Fahrenheit
Instances: 253
9.6.14.6 Inside Humidity
Displays the relative humidity from a humidity sensor set up with a source of “Inside”
Component Types: Bar Graph, Digital, Line Graph
Units: Percent
Instances: 253
9.6.14.7 Inside Temperature
Displays the temperature from a temperature sensor set up with a source of “Inside”.
Component Types: Gauge, Status Bars, Bar Graph, Digital, Line Graph
Units: degrees Centigrade, degrees Fahrenheit
Instances: 253
9.6.14.8 Live Well Temperature
Displays the temperature from a temperature sensor set up with a source of “Live Well”.
Component Types: Gauge, Status Bars, Bar Graph, Digital, Line Graph
Units: degrees Centigrade, degrees Fahrenheit
Instances: 253
9.6.14.9 Main Cabin Temperature
Displays the temperature from a temperature sensor set up with a source of “Main Cabin”.
Component Types: Gauge, Status Bars, Bar Graph, Digital, Line Graph
Units: degrees Centigrade, degrees Fahrenheit
Instances: 253
9.6.14.10 Moon Phase
Displays the phase of the moon at the current time and date
Component Types: Moon Phase Display
9.6.14.11 Outside Humidity
Displays the relative humidity from a humidity sensor set up with a source of “Outside”
Component Types: Bar Graph, Digital, Line Graph
Units: Percent
Instances: 253
9.6.14.12 Outside Temperature
Displays the temperature from a temperature sensor set up with a source of “Outside”.
Component Types: Gauge, Status Bars, Bar Graph, Digital, Line Graph
Units: degrees Centigrade, degrees Fahrenheit
Instances: 253
9.6.14.13 Sea Temperature
Displays the temperature from a temperature sensor set up with a source of “Sea”.
Component Types: Gauge, Status Bars, Bar Graph, Digital, Line Graph
Units: degrees Centigrade, degrees Fahrenheit
Instances: 253
9.6.14.14 Sunrise
Displays the local time of sunrise for the current day and position
Component Types: Digital
Units: 12 hour; 24 hour
Time Zone: Selectable
9.6.14.15 Sunset
Displays the local time of sunset for the current day and position
Component Types: Digital
Units: 12 hour; 24 hour
9.6.14.16 Twilight AM
Displays the UTC time of nautical twilight before sunrise for the current day
Component Types: Digital
Units: 12 hour; 24 hour
Time Zone: Selectable
9.6.14.17 Twilight PM
Displays the local time of nautical twilight after sunset for the current day
Component Types: Digital
Units: 12 hour; 24 hour
Time Zone: Selectable
9.6.14.18 Wind Chill
Displays the current wind chill based on outside air temperature and wind speed
Component Types: Digital
Units: Degrees Centigrade, Degrees Fahrenheit
9.6.14.19 User Defined nnn Humidity
Displays the relative humidity from a humidity sensor set up with a source of “User Defined nnn”, where nnn is a number from 128 to 144.
Component Types: Bar Graph, Digital, Line Graph
Units: Percent
Instances: 253
9.6.14.20 User Defined nnn Temperature
Displays the temperature from a temperature sensor set up with a source of “User Defined nnn”, where nnn is a number from 128 to 144.
Component Types: Gauge, Status Bars, Bar Graph, Digital, Line Graph
Units: degrees Centigrade, degrees Fahrenheit
Instances: 253
9.6.15 Fuel Management
![]()
![]() Maretron fuel management products are designed to be accurate
and reliable; however they should be used only as aids for fuel management and
not as a replacement for traditional fuel management techniques. BEWARE:
Conditions can quickly change that drastically affect time and distance to
empty.
Maretron fuel management products are designed to be accurate
and reliable; however they should be used only as aids for fuel management and
not as a replacement for traditional fuel management techniques. BEWARE:
Conditions can quickly change that drastically affect time and distance to
empty.
You should not use the fuel management data types unless you fully understand all the parameters associated with fuel management. All fuel tanks and all engines must be included when setting up N2KView plus there must be accurate fuel rate sensors installed on the vessel and accurate speed information in order for N2KView to properly display fuel management information. You should also note that fuel levels may contain significant error if the boat is not sitting level in the water (i.e., sailboat heeled over or a power boat riding bow up won’t necessarily report the correct amount of fuel). Even when set up correctly, N2KView should be used only as an aid and not the sole source for fuel management information.
![]()
NOTE: These functions are available in the optional Fuel Management Module. If the Fuel Management Module is not licensed, the component will display “Not Licensed” instead of data values.
The Distance to Empty and Time to Empty measurements are calculated based on the conditions that are prevalent at the time. Changes in wind and current can drastically change the Distance to Empty and Time to Empty measurements that N2KView calculates and displays.
For example, if you are motoring 100 miles out to sea with the current, at the end of the 100 miles, N2KView might display that you have 120 miles before you run out of fuel. If you then turn around and start heading back to land, this time against the current, the Distance to Empty reading may change to 80 miles.
Therefore, you must always keep in mind the direction and speed of prevailing winds and currents. You must always remain aware that N2KView makes Distance to Empty and Time to Empty calculations assuming that your course and speed, and the prevailing winds and currents, and any other factors that may affect fuel consumption will not change.
Because of these extremely important considerations of which you must be aware before using the fuel management features of N2KView, the “Fuel Management Warning” screen is displayed on the following occasions: 1) every time you create a component in the fuel management category, and 2) the first time after starting N2KView that you open a favorites page containing a fuel management component.
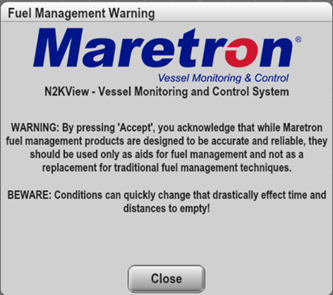
Figure 112 – Fuel Management Warning Screen
9.6.15.1 Distance to Empty
NOTE: This function is available in the optional Fuel Management Module. If the Fuel Management Module is not licensed, the component will display “Not Licensed” instead of data values.
This component displays the distance before the selected engines use all fuel in the selected fuel tanks assuming that all factors affecting fuel consumption remain constant.
Component Types: Gauge, Status Bars, Bar Graph, Digital, Line Graph
Units: kilometers, nautical miles, statute miles
9.6.15.2 Time to Empty
NOTE: This function is available in the optional Fuel Management Module. If the Fuel Management Module is not licensed, the component will display “Not Licensed” instead of data values.
This component displays the time before the selected engines use all fuel in the selected fuel tanks assuming that all factors affecting fuel consumption remain constant.
Component Types: Digital
Units: hours
9.6.15.3 Total Fuel Capacity
NOTE: This function is available in the optional Fuel Management Module. If the Fuel Management Module is not licensed, the component will display “Not Licensed” instead of data values.
This component displays the total of the capacities of all the tanks setup with tank type of “Fuel”, and whose instance numbers match those in the supplied list.
Component Types: Gauge, Status Bars, Bar Graph, Digital
Units: imp gals/kilometer, liters/kilometer, gals/kilometer, imp gals/nautical mile, liters/nautical mile, gals/nautical mile, imp gals/statute mile, liters/statute mile, gals/statute mile
9.6.15.4 Total Fuel Consumption (Vol./Dis.)
NOTE: This function is available in the optional Fuel Management Module. If the Fuel Management Module is not licensed, the component will display “Not Licensed” instead of data values.
This component displays the total of the fuel consumption of all selected engines per unit distance.
Component Types: Gauge, Status Bars, Bar Graph, Digital
Units: imp gals/kilometer, liters/kilometer, gals/kilometer, imp gals/nautical mile, liters/nautical mile, gals/nautical mile, imp gals/statute mile, liters/statute mile, gals/statute mile
9.6.15.5 Total Fuel Economy (Dis./Vol.)
NOTE: This function is available in the optional Fuel Management Module. If the Fuel Management Module is not licensed, the component will display “Not Licensed” instead of data values.
Displays the distance traveled per unit of fuel consumed by all selected engines.
Component Types: Gauge, Status Bars, Bar Graph, Digital
Units: kilometers/imp gal, kilometers/liter, kilometers/gal, nautical miles/imp gal, nautical miles/liter, nautical miles/gal, statute miles/imp gal, statute miles/liter, statute miles/gal
9.6.15.6 Total Fuel Level
NOTE: This function is available in the optional Fuel Management Module. If the Fuel Management Module is not licensed, the component will display “Not Licensed” instead of data values.
This component displays the fractional level of the fuel in all the tanks setup with tank type of “Fuel”, and whose instance numbers match those in the supplied list. This is computed by dividing the total fuel remaining by the total fuel capacity.
Component Types: Digital, Bar Graph, Gauge
Units: %
9.6.15.7 Total Fuel Rate
NOTE: This function is available in the optional Fuel Management Module. If the Fuel Management Module is not licensed, the component will display “Not Licensed” instead of data values.
This component displays the total of the fuel consumed per unit time of all selected engines.
Component Types: Gauge, Status Bars, Bar Graph, Digital
Units: imp gal/hour, liter/hour, gal/hour
9.6.15.8 Total Fuel Remaining
NOTE: This function is available in the optional Fuel Management Module. If the Fuel Management Module is not licensed, the component will display “Not Licensed” instead of data values.
This component displays the total amount of fuel remaining in all the tanks setup with tank type of “Fuel”, and whose instance numbers match those in the supplied list.
Component Types: Gauge, Status Bars, Bar Graph, Digital
Units: imp gal, liter, gal
9.6.15.9 Trip Fuel Used
This component displays the amount of fuel used by an Engine since last reset for the trip. The Component has a reset button in the bottom left to reset the value at the start of the trip.
Component Types: Gauge, Status Bars, Bar Graph, Digital, Line Graph
Units: imp gal, liter, gal
9.6.15.10 Total Trip Fuel Used
NOTE: This function is available in the optional Fuel Management Module. If the Fuel Management Module is not licensed, the component will display “Not Licensed” instead of data values.
This component displays the total amount of fuel used by all Engines whose instance number is included in the supplied list since last reset for the trip.
Component Types: Gauge, Status Bars, Bar Graph, Digital
Units: imp gal, liter, gal
9.6.16 GPS
9.6.16.1 Course Over Ground
Displays the current course over ground
Component Types: North Up Rose, Course Up Rose, Cardinal, Digital
Units: Degrees True, Degrees Magnetic (depends on Global Settings in Units Setup tab)
Instances: 253
9.6.16.2 GPS Status
Displays the current operating mode and status of the currently selected GPS received (please see Section 9.5.13 on page 148 for more details)
Component Types: GPS Status
Instances: 253
9.6.16.3 Lat / Lon
Displays the current latitude and longitude of the vessel
Component Types: Digital
Units: Latitude and Longitude in Degrees, Minutes and fractions of a minute.
Instances: 253
9.6.16.4 Speed Over Ground
Displays the current speed over ground
Component Types: Gauge, Status Bars, Digital
Units kilometers/hour, knots, miles/hour
Instances: 253
9.6.17 Heading
9.6.17.1 Heading
Displays the current heading of the vessel (the direction the vessel is pointing) relative to true or magnetic north depending on the setting of the heading parameter (see Section 9.4.12.2.5) in the Units Dialog.
Component Types: North Up Rose, Course Up Rose, Cardinal, Digital
Units: Degrees True or Degrees Magnetic
Instances: 253
9.6.17.2 Rate of Turn
Displays the rate at which the heading is changing.
Component Types: Gauge, Status Bars, Digital, Line Graph
Units: Degrees / Minute, Degrees / Second
Instances: 253
9.6.17.3 Variation
Displays the magnetic variation used to convert between true and magnetic headings
Component Types: Digital
Units: degrees.
When displayed, the units will be appended with the method by which the variation was obtained. (e.g. Manually, Calculated, from WMM 2010 tables)
Instances: 253
9.6.18 Humidity
See Environment (section 9.6.14.6) for a Humidity details.
9.6.19 Ice Makers
9.6.19.1 Eskimo
This component displays the status of an Eskimo Ice Maker on the system.
Component Types: Ice Maker
Instances: 253
This would be the instance of the J2K100 bridge to which the Ice Maker is connected.
9.6.20 Indicator
9.6.20.1 Hardware Counter
Maretron’s SIM100, RIM100 and DCR100 are now equipped with an internal hardware counter. Use this parameter to read the value of the internal hardware counter. Pressing the reset button will command the counter within the device to zero.
Component Types: Digital Counter.
Instances: 253
Channels (Per Instance): 28
9.6.20.2 Hardware Timer
Maretron’s SIM100, RIM100 and DCR100 are now equipped with an internal hardware timer. Use this parameter to read the value of the internal hardware timer. Pressing the reset button will command the timer within the device to zero.
Component Types: Digital Timer.
Instances: 253
Channels (Per Instance): 28
9.6.20.3 Status
This component displays the status of a switch on the system.
Component Types: Indicators, Digital Counter, Digital Timer, Indicator Graph.
Instances: 253
Channels (Per Instance): 28
Note: Choosing a component type of Digital Counter or Digital Timer will create a software timer within N2KView that counts or times the status changes. This counter or timer is independent of the counter or timer built in to a device. Restarting N2KView will reset the software counters or timers to zero.
9.6.20.4 Switch/Breaker Group Status
This component displays the status of a Switch/Breaker Group on the system. The status is considered “ON’ when all the breakers or indicators specified in the group are in the state desired by the group.
Component Types: Indicators, Digital Counter, Digital Timer, Indicator Graph.
Groups: Select a Breaker/Switch Group already defined
Note: Choosing a component type of Digital Counter or Digital Timer will create a software timer within N2KView that counts or times the status changes. This counter or timer is independent of the counter or timer built in to a device. Restarting N2KView will reset the software counters or timers to zero.
9.6.21 Mechanical
9.6.21.1 Decibel
A 4-20 mA current loop decibel transducer may be connected to Maretron’s CLM100 to measure decibel levels
Component Types: Bar Graph, Gauge, Status Bars, Digital, Line Graph
Units: Decibels
Instances: 253
9.6.21.2 Force
A 4-20 mA current loop force transducer (such as a Clevis pin) may be connected to Maretron’s CLM100 to measure forces
Component Types: Bar Graph, Gauge, Status Bars, Digital, Line Graph
Units: Kilogram-force, Newtons, kiloNewtons, Pound-force, metric-ton-force
Instances: 253
9.6.21.3 Strain
A 4-20 mA current loop strain transducer may be connected to Maretron’s CLM100 to measure strain
Component Types: Bar Graph, Gauge, Status Bars, Digital, Line Graph
Units: Microstrain
Instances: 253
9.6.22 Motion
9.6.22.1 Acceleration
A 4-20 mA current loop decibel transducer may be connected to Maretron’s CLM100 to measure acceleration.
Component Types: Bar Graph, Gauge, Status Bars, Digital, Line Graph
Units: m/s2, ft/s2, g
Instances: 253
9.6.22.2 Angle
A 4-20 mA current loop strain transducer may be connected to Maretron’s CLM100 to measure angle
Component Types: Bar Graph, Gauge, Status Bars, Digital, Line Graph
Units: Degrees
Instances: 253
9.6.22.3 Angular Acceleration
A 4-20 mA current loop strain transducer may be connected to Maretron’s CLM100 to measure angular acceleration
Component Types: Bar Graph, Gauge, Status Bars, Digital, Line Graph
Units: Degrees/min2, degrees/sec2
Instances: 253
9.6.22.4 Angular Velocity
A 4-20 mA current loop strain transducer may be connected to Maretron’s CLM100 to measure angular velocity
Component Types: Bar Graph, Gauge, Status Bars, Digital, Line Graph
Units: Degrees/min, degrees/sec
Instances: 253
9.6.22.5 Distance
A 4-20 mA current loop strain transducer may be connected to Maretron’s CLM100 to measure distance
Component Types: Bar Graph, Gauge, Status Bars, Digital, Line Graph
Units: mm, cm, m, in, ft
Instances: 253
9.6.22.6 Rotational Rate
A 4-20 mA current loop strain transducer may be connected to Maretron’s CLM100 to measure rotational rate.
Component Types: Bar Graph, Gauge, Status Bars, Digital, Line Graph
Units: RPM
Instances: 253
9.6.22.7 Velocity
A 4-20 mA current loop force transducer may be connected to Maretron’s CLM100 to measure velocity
Component Types: Bar Graph, Gauge, Status Bars, Digital, Line Graph
Units: m/s, ft/s, inch/s, mph, km/h, NM/h
Instances: 253
9.6.23 NMEA 2000 – N2KView Connection
9.6.23.1 Cloud Server Data Remaining
Maretron’s Real Time Cloud Server is a subscription based service; users purchase monthly bandwidth, and the amount of bandwidth remaining in the current month may be displayed on this control.
Component Types: Gauge. Bar Graph, Digital
Instances: not applicable
Units: Gigabytes
The Maretron Real Time Cloud server cannot be accessed from the TSM800C, TSM810C, TSM1330C, MBB200C, or the MBB300C, so this parameter is not available.
9.6.23.2 Cloud Server Data Used
Maretron’s Real Time Cloud Server is a subscription based service; users purchase monthly bandwidth, and the amount of bandwidth used in the current month may be displayed on this control.
Component Types: Gauge. Bar Graph, Digital
Instances: not applicable
Units: Gigabytes
The Maretron Real Time Cloud server cannot be accessed from the TSM800C, TSM810C, TSM1330C, MBB200C, or the MBB300C, so this parameter is not available.
9.6.23.3 Cloud Server Percent Remaining
Maretron’s Real Time Cloud Server is a subscription based service; users purchase monthly bandwidth, and the percentage of bandwidth remaining in the current month may be displayed on this control.
Component Types: Gauge. Bar Graph, Digital
Instances: not applicable
Units: %
The Maretron Real Time Cloud server cannot be accessed from the TSM800C, TSM810C, TSM1330C, MBB200C, or the MBB300C, so this parameter is not available.
9.6.23.4 Cloud Server Percent Used
Maretron’s Real Time Cloud Server is a subscription based service; users purchase monthly bandwidth, and the percentage of bandwidth used in the current month may be displayed on this control.
Component Types: Gauge. Bar Graph, Digital
Instances: not applicable
Units: %
The Maretron Real Time Cloud server cannot be accessed from the TSM800C, TSM810C, TSM1330C, MBB200C, or the MBB300C, so this parameter is not available.
9.6.23.5 NMEA 2000 Connection
This component displays the status of the connection between N2KView and the NMEA 2000 bus through the IPG100 or USB100.
Component Types: Indicator Light, Digital Counter, Timer.
Instances: not applicable
9.6.23.6 NMEA 2000 Connection (CAN 2)
This component displays the status of the second connection (if applicable) between N2KView and the NMEA 2000 bus. The second connection is only available on the MBB300C, TSM800C, TSM810C, and TSM1330C, but to allow Configurations to be prepared on PCs for later transfer to a MBB300C or TSM810C the component may be created on PCs as well.
Component Types: Indicator Light, Digital Counter, Timer.
Instances: not applicable
9.6.24 Navigation
N2KView is not a primary navigator; that is, it does not provide means for entering and storing waypoint and route data. N2KView can receive information on the current leg of the voyage from a primary navigation device (such as a chart plotter or PC with navigation software and NMEA 2000 interface) and display the following information:
9.6.24.1 Bearing Origin to Destination
Displays the direction from the origin waypoint to the destination waypoint
Component Types: Digital
Instances: 253
Units: True, Magnetic (depends on Global Settings in Units Setup tab)
9.6.24.2 Bearing to Waypoint
Displays the bearing to the destination waypoint
Component Types: Heading, Digital
Instances: 253
Units: True, Magnetic (depends on Global Settings in Units Setup tab)
9.6.24.3 Course Over Ground
Displays the current course over ground
Component Types: North Up Rose, Course Up Rose, Cardinal, Digital
Instances: 253
Units: Degrees True, Degrees Magnetic (depends on Global Settings in Units Setup tab)
9.6.24.4 Cross Track Error
Displays the cross-track error (minimum distance from the boat to the programmed route)
Component Types: Gauge, Status Bars, Bar Graph, Digital, Line Graph
Instances: 253
Units: kilometers, nautical miles, statute miles
9.6.24.5 Destination Waypoint No.
Displays the number of the destination waypoint in the current route.
Component Types: Digital
Instances: 253
Units: number
9.6.24.6 Distance to Waypoint
Displays the distance to the destination waypoint
Component Types: Gauge, Status Bars, Bar Graph, Digital, Line Graph
Instances: 253
Units: kilometers, nautical miles, statute miles
9.6.24.7 ETA
Displays the estimated time of arrival at the destination waypoint
Component Types: Digital
Instances: 253
Units: 12 hours, 24 hours
9.6.24.8 ETA Date
Displays the estimated date of arrival at the destination waypoint
Component Types: Digital
Instances: 253
Units: DD-MM-YYYY,
DD-MMM-YYYY, MM-DD-YYYY,
MMM-DD-YYYY
9.6.24.9 Lat/Lon
Displays the current latitude and longitude of the vessel
Component Types: Digital
Instances: 253
9.6.24.10 Speed Over Ground
Displays the current speed over ground of the vessel
Component Types: Gauge, Status Bars, Digital, Line Graph
Instances: 253
Units: kilometers/hour, knots, miles/hour
9.6.24.11 Time to Go
Displays the estimated time remaining until arrival at the destination waypoint assuming current speed and course remain constant
Component Types: Digital
Instances: 253
Units: hh:mm:ss, hh:mm
9.6.24.12 Velocity to Waypoint
Displays the speed at which the distance to the waypoint is decreasing
Component Types: Gauge, Status Bars, Bar Graph, Digital, Line Graph
Instances: 253
Units: kilometers/hour, nautical miles/hour, miles/hour
9.6.25 Pressure / Vacuum
Note that the User Defined Pressures have additional units, and can be displayed in depth of water. This is useful for measuring the depth of an object under the water.
9.6.25.1 Barometric Pressure
Displays the atmospheric (barometric) pressure
Component Types: Gauge, Vacuum Gauge, Status Bars, Bar Graph, Line Graph, Digital
Units: bars, millibars, inches Mercury (inHg), kilopascals, millimeters Mercury (mmHg)
Instances: 253
9.6.25.2 Compressed Air Pressure
Displays the pressure from a pressure sensor set up with a source of “Compressed Air”
Component Types: Gauge, Vacuum Gauge, Status Bars, Bar Graph, Line Graph, Digital
Units: bars, psi, kilopascals
Instances: 253
9.6.25.3 Engine Boost Pressure
Displays the Engine Boost Pressure from an Engine
Component Types: Gauge, Vacuum Gauge, Status Bars, Bar Graph, Line Graph, Digital
Units: bars, psi, kilopascals
Instances: 253
9.6.25.4 Engine Coolant Pressure
Displays the Engine Coolant Pressure from an Engine
Component Types: Gauge, Vacuum Gauge, Status Bars, Bar Graph, Line Graph, Digital
Units: bars, psi, kilopascals
Instances: 253
9.6.25.5 Engine Fuel Pressure
Displays the Fuel Pressure from an Engine
Component Types: Gauge, Vacuum Gauge, Status Bars, Bar Graph, Line Graph, Digital
Units: bars, psi, kilopascals
Instances: 253
9.6.25.6 Engine Oil Pressure
Displays the Oil Pressure from an Engine
Component Types: Gauge, Vacuum Gauge, Status Bars, Bar Graph, Line Graph, Digital
Units: bars, psi, kilopascals
Instances: 253
9.6.25.7 Hydraulic Oil Pressure
Displays the pressure from a pressure sensor set up with a source of “Hydraulic Oil”
Component Types: Gauge, Vacuum Gauge, Status Bars, Bar Graph, Line Graph, Digital
Units: bars, psi, kilopascals
Instances: 253
9.6.25.8 Steam Pressure
Displays the pressure from a pressure sensor set up with a source of “Steam”
Component Types: Gauge, Vacuum Gauge, Status Bars, Bar Graph, Line Graph, Digital
Units: bars, psi, kilopascals
Instances: 253
9.6.25.9 Transmission Oil Pressure
Displays the Oil Pressure from a Transmission.
Component Types: Gauge, Vacuum Gauge, Status Bars, Bar Graph, Line Graph, Digital
Units: bars, psi, kilopascals
Instances: 253
9.6.25.10 Water Pressure
Displays the pressure from a pressure sensor set up with a source of “Water”
Component Types: Gauge, Vacuum Gauge, Status Bars, Bar Graph, Line Graph, Digital
Units: bars, psi, kilopascals
Instances: 253
9.6.25.11 User Defined nnn Pressure
Displays the pressure from a pressure sensor set up with a source of “User Defined nnn”, where nnn is a number from 128 to 144.
Component Types: Gauge, Vacuum Gauge, Status Bars, Bar Graph, Line Graph, Digital
Units: kPa, bar, psi, feet of water, inches of water, meters of water
Instances: 253
9.6.26 Rudder
9.6.26.1 Rudder Angle
Displays the angle of the vessel’s rudder as indicated by the rudder sensor
Component Types: Rudder Angle, Digital
Units: Degrees
Instances: 253
9.6.26.2 Rudder Angle/Order
Displays the angle of the vessel’s rudder as indicated by the rudder sensor, as well as the angle to which a vessel’s rudder has been commanded be an autopilot or steering mechanism.
Component Types: Rudder Angle
Units: Degrees
Instances: 253
9.6.26.3 Rudder Order
Displays the angle to which a vessel’s rudder has been commanded be an autopilot or steering mechanism.
Component Types: Digital
Units: Degrees
9.6.27 SMS (Text Message)
9.6.27.1 SMS Status (Indicator)
Displays the status of the connection to the mobile network over which SMS (Text) messages will be sent.
Component Types: Indicator Light, Small Indicator Light, Digital Counter, Timer.
9.6.27.2 SMS Status
Displays the status of the connection to the mobile network over which the SMS (Text) messages will be sent.
Component Types: Digital.
A two line digital display will be used to display the status of the connection and the provider / phone number of the SMS100.
9.6.27.3 Signal Strength
Displays the signal strength of the mobile network over which the SMS (Text) messages will be sent.
Component Types: Signal Strength.
9.6.27.4 Text Message (SMS)
Displays received Text Messages from mobile phones. Messages may also be entered in this control for transmission to mobile phone numbers in the Alert SMS Setup dialog.
Component Types: Text Message.
9.6.28 Screen Selection
9.6.28.1 Screen Select
This creates an active button that, when pressed, will either open a dialog or navigate to a favorite screen, depending on the Button Type chosen in the editor.
The options for button type are
· Screen Select - The Alerts Screen or any User-defined screen
· Back – the previously viewed screen
· Home – a direct jump to the first screen with “home” in its name.
· Vessel Mode – a direct jump to the first screen with the Vessel Operating Mode in its name.
· Show Tabs – displays the tabs
· Power – Opens the Power Management Sub-menu (9.4.8)
· Breaker Lockout dialog – Opens the Breaker Lockout dialog (9.4.8.1) for the page on which the Screen Select button is located
· Breaker Status dialog – Opens the Breaker Status dialog (9.4.8.2) for the page on which the Screen Select button is located
· About – Opens the About dialog (9.4.1)
· Clean Screen – Opens the Clean Screen dialog (9.4.5)
· General Configuration – Opens the General Configuration dialog (9.4.6.1)
· Operating Mode – Opens the Operating Mode dialog (10.4.5)
9.6.28.2 Screen Status
This creates a Screen Status button, which gives a summary
of the status of controls on another screen (see section 9.5.39).
9.6.29 Speed/Distance
9.6.29.1 Speed Over Ground
Displays the speed over ground of the vessel (relative to the earth, not the water)
Component Types: Gauge, Status Bars, Digital, Line Graph
Units: kilometers/hour, knots, miles/hour
Instances: 253
9.6.29.2 Speed Through Water
Displays the speed of the boat relative to the water
Component Types: Gauge, Status Bars, Digital, Line Graph
Units: kilometers/hour, knots, miles/hour
Instances: 253
9.6.29.3 Total Log
Displays the total distance traveled by the vessel since the log indicator was installed
Component Types: Gauge, Status Bars, Bar Graph, Digital, Line Graph
Units: kilometers, nautical miles, statute miles
9.6.29.4 Trip Log
Displays the distance traveled by the vessel since the trip indication of the log indicator was last reset. The value may be reset by pressing a button on the bottom left of the component.
Component Types: Gauge, Status Bars, Bar Graph, Digital, Line Graph
Units: kilometers, nautical miles, statute miles
9.6.30 Tank
9.6.30.1 Capacity
Displays the fluid capacity of the tank
Component Types: Digital
Units: imp gal, Liter, gal
Source: Fuel, Fresh Water, Waste Water, Live Well, Oil, Black Water, Reserved 0-7
Instances: 16
9.6.30.2 Level
Displays the level of fluid in the tank as a percentage of its capacity
Component Types: Gauge, Status Bars, Bar Graph, Tank, Digital, Line Graph
Units: percent
Source: Fuel, Fresh Water, Waste Water, Live Well, Oil, Black Water, Reserved 0-7
Instances: 16
9.6.30.3 Remaining
Displays the amount of fluid in the tank
Component Types: Gauge, Status Bars, Bar Graph, Tank, Digital, Line Graph
Units: imp gal, Liter, gal
Source: Fuel, Fresh Water, Waste Water, Live Well, Oil, Black Water, Reserved 0-7
Instances: 16
9.6.30.4 Total Capacity
Displays the total fluid capacity of all selected tanks
Component Types: Digital
Units: imp gal, Liter, gal
Source: Fuel, Fresh Water, Waste Water, Live Well, Oil, Black Water, Reserved 0-7
Instances: 16
9.6.30.5 Total Level
Displays the level of fluid in all selected tanks as a percentage of their total capacity
Component Types: Gauge, Status Bars, Bar Graph, Tank, Digital, Line Graph
Units: percent
Source: Fuel, Fresh Water, Waste Water, Live Well, Oil, Black Water, Reserved 0-7
Instances: 16
9.6.30.6 Total Remaining
Displays the total amount of fluid in all of the selected tanks
Component Types: Gauge, Status Bars, Bar Graph, Tank, Digital, Line Graph
Units: imp gal, Liter, gal
Source: Fuel, Fresh Water, Waste Water, Live Well, Oil, Black Water, Reserved 0-7
Instances: 16
9.6.31 Temperature
9.6.31.1 Bait Well Temperature
Displays the temperature from a temperature sensor set up with a source of “Bait Well”.
Component Types: Gauge, Status Bars, Bar Graph, Digital, Line Graph
Units: degrees Centigrade, degrees Fahrenheit
Instances: 253
9.6.31.2 Battery Temperature
See section 9.6.8.4
9.6.31.3 Dew Point
See section 9.6.14.3
9.6.31.4 Difference in Temperature
This component allows you to display the difference between 2 temperatures.
Component Types: Gauge, Status Bars, Bar Graph, Digital, Line Graph
Units: degrees Centigrade, degrees Fahrenheit
A special component editor is used here to allow source and instance temperature#1 and temperature#2 to be entered separately.
9.6.31.5 Engine Coolant Temperature
See section .9.6.12.3
9.6.31.6 Engine Oil Temperature
See section 9.6.12.6.
9.6.31.7 Exhaust Gas Temperature
Displays the temperature from a temperature sensor set up with a source of “Exhaust Gas”.
Component Types: Gauge, Status Bars, Bar Graph, Digital, Line Graph
Units: degrees Centigrade, degrees Fahrenheit
Instances: 253
9.6.31.8 Freezer Temperature
Displays the temperature from a temperature sensor set up with a source of “Freezer”.
Component Types: Gauge, Status Bars, Bar Graph, Digital, Line Graph
Units: degrees Centigrade, degrees Fahrenheit
Instances: 253
9.6.31.9 Heat Index
See section 9.6.14.5
9.6.31.10 Heating System Temperature
Displays the temperature from a temperature sensor set up with a source of “Heating System”.
Component Types: Gauge, Status Bars, Bar Graph, Digital, Line Graph
Units: degrees Centigrade, degrees Fahrenheit
Instances: 253
9.6.31.11 Inside Temperature
Displays the temperature from a temperature sensor set up with a source of “Inside”.
Component Types: Gauge, Status Bars, Bar Graph, Digital, Line Graph
Units: degrees Centigrade, degrees Fahrenheit
Instances: 253
9.6.31.12 Live Well Temperature
Displays the temperature from a temperature sensor set up with a source of “Live Well”.
Component Types: Gauge, Status Bars, Bar Graph, Digital, Line Graph
Units: degrees Centigrade, degrees Fahrenheit
Instances: 253
9.6.31.13 Main Cabin Temperature
Displays the temperature from a temperature sensor set up with a source of “Main Cabin”.
Component Types: Gauge, Status Bars, Bar Graph, Digital, Line Graph
Units: degrees Centigrade, degrees Fahrenheit
Instances: 253
9.6.31.14 Outside Temperature
Displays the temperature from a temperature sensor set up with a source of “Outside”.
Component Types: Gauge, Status Bars, Bar Graph, Digital, Line Graph
Units: degrees Centigrade, degrees Fahrenheit
Instances: 253
9.6.31.15 Refrigeration Temperature
Displays the temperature from a temperature sensor set up with a source of “Refrigeration”.
Component Types: Gauge, Status Bars, Bar Graph, Digital, Line Graph
Units: degrees Centigrade, degrees Fahrenheit
Instances: 253
9.6.31.16 Sea Temperature
Displays the temperature from a temperature sensor set up with a source of “Sea”.
Component Types: Gauge, Status Bars, Bar Graph, Digital, Line Graph
Units: degrees Centigrade, degrees Fahrenheit
Instances: 253
9.6.31.17 Shaft Seal Temperature
Displays the temperature from a temperature sensor set up with a source of “Shaft Seal”.
Component Types: Gauge, Status Bars, Bar Graph, Digital, Line Graph
Units: degrees Centigrade, degrees Fahrenheit
Instances: 253
9.6.31.18 Transmission Oil Temperature
See section 9.6.35.3
9.6.31.19 Wind Chill
See section 0.
9.6.31.20 User Defined nnn Temperature
Displays the temperature from a temperature sensor set up with a source of “User Defined nnn”, where nnn is a number from 128 to 144.
Component Types: Gauge, Status Bars, Bar Graph, Digital, Line Graph
Units: degrees Centigrade, degrees Fahrenheit
Instances: 253
9.6.32 Text
9.6.32.1 Multi-line Text
This component allows the creation of a block of user-defined text on the screen.
Component Types: Multi-line Text 1x1, Multi-line Text 2x1, Multi-line Text 4x1,
9.6.32.2 Text
This component allows the creation of a single line of fixed, user-defined text on the screen.
Component Types: Text
9.6.33 Thruster
9.6.33.1 Azimuth
If supported by the thruster, this displays the direction (relative to the bow) that the thruster is angled., It will probably only be present on thrusters that rotate.
Component Types: Head-up Bearing, Digital, Line Graph
Units: Degrees, negative values are to port
Instances: 253
Thrusters: 30
9.6.33.2 Boat Over Speed Warning
If supported by the thruster, this displays a warning when the boat speed is too fast to safely use the thruster.
Component Types: Indicator, Digital Counter, Digital Timer, Indicator Graph
Units: OK | Warning
Instances: 253
Thrusters: 30
9.6.33.3 Direction
If supported by the thruster, this displays the thruster direction control.
Component Types: Digital
Units: Off | Ready | Port | Starboard
Instances: 253
Thrusters: 30
9.6.33.4 High Oil Temperature Warning
If supported by the thruster, this displays a warning when the Thruster Motor Oil Temperature is too high.
Component Types: Indicator, Digital Counter, Digital Timer, Indicator Graph
Units: OK | Warning
Instances: 253
Thrusters: 30
9.6.33.5 Low Controller Voltage Warning
If supported by the thruster, this displays a warning when the voltage to the thruster controller is too low.
Component Types: Indicator, Digital Counter, Digital Timer, Indicator Graph
Units: OK | Warning
Instances: 253
Thrusters: 30
9.6.33.6 Low Oil Level Warning
If supported by the thruster, this displays a warning when the Thruster Motor Oil Level is too low.
Component Types: Indicator, Digital Counter, Digital Timer, Indicator Graph
Units: OK | Warning
Instances: 253
Thrusters: 30
9.6.33.7 Motor Current
If supported by the thruster, this displays the electrical current being drawn by the thruster motor.
Component Types: Gauge, Status Bars, Digital, Line Graph
Units: Amps
Instances: 253
Thrusters: 30
9.6.33.8 Motor Operating Time
If supported by the thruster, this displays the total time the thruster has operated since its last reset.
Component Types: Digital
Units: hh:mm
Instances: 253
Thrusters: 30
9.6.33.9 Over Current Cutout
If supported by the thruster, this displays a warning when the Thruster has cut out due to drawing excessive current.
Component Types: Indicator, Digital Counter, Digital Timer, Indicator Graph
Units: OK | Warning
Instances: 253
Thrusters: 30
9.6.33.10 Over Temperature Cutout
If supported by the thruster, this displays a warning when the Thruster has cut out due to overheating.
Component Types: Indicator, Digital Counter, Digital Timer, Indicator Graph
Units: OK | Warning
Instances: 253
Thrusters: 30
9.6.33.11 Power Enable
If supported by the thruster, this displays a switch or push button that will enable the power supply to the thruster. The thruster may be controlled from here.
Component Types: Switch, Push Button
Units: Off | On | Error
Instances: 253
Thrusters: 30
9.6.33.12 Retraction Status
If supported by the thruster, this displays a switch or push button that will enable the power supply to the thruster. The thruster may be controlled from here.
Component Types: Switch, Push Button
Units: Off | Extend | Retract
Instances: 253
Thrusters: 30
9.6.33.13 Speed
If supported by the thruster, this displays the speed of the thruster motor.
Component Types: Gauge, Status Bars, Digital, Line Graph
Units: % of maximum speed
Instances: 253
Thrusters: 30
9.6.34 Time/Date
9.6.34.1 Date
Displays the current date. The time zone may be entered as part of the component configuration, or it may be set to reference the local time offset (see Section 9.4.8.3.1 for details on how to set the local time offset)
Component Types: Digital
Units: Default,
DD-MM-YYYY, DD-MMM-YYYY,
MM-DD-YYYY, MMM-DD-YYYY
When the units are set to “Default”, the formatting for the displayed date is obtained from the Units Setup Page.
9.6.34.2 Local Time Offset
Displays the local time offset as set in the Units Setup Page.
Component Types: Digital
Units: Hours : Minutes
9.6.34.3 Moon Phase
Displays the phase of the moon at the current time and location
Component Types: Moon Phase Display
9.6.34.4 Sunrise
Displays the time of sunrise for the current day and position. The time zone may be entered as part of the component configuration
Component Types: Digital
Units: 12 hour, 24 hour
9.6.34.5 Sunset
Displays the time of sunset for the current day and position. The time zone may be entered as part of the component configuration
Component Types: Digital
Units: 12 hour, 24 hour
9.6.34.6 Time
Displays the current time. The time zone may be entered as part of the component configuration.
Component Types: Digital
Units: 12 hour, 24 hour
9.6.34.7 Twilight AM
Displays the time of nautical twilight before sunrise for the current day and position. The time zone may be entered as part of the component configuration.
Component Types: Digital
Units: 12 hour, 24 hour
9.6.34.8 Twilight PM
Displays the time of nautical twilight after sunset for the current day and position. The time zone may be entered as part of the component configuration.
Component Types: Digital
Units: 12 hour, 24 hour
9.6.35 Transmission
9.6.35.1 Gear
Displays the current gear of the transmission (forward, neutral, or reverse)
Display: Digital
Instances: 253
9.6.35.2 Transmission Oil Pressure
Displays the pressure of the oil in the transmission
Component Types: Gauge, Status Bars, Digital, Line Graph
Units: kilopascals, bars, pounds/square inch
Instances: 253
9.6.35.3 Transmission Oil Temperature
Displays the temperature of the oil in the transmission
Component Types: Gauge, Status Bars, Bar Graph, Digital
Units: Degrees Centigrade, Degrees Fahrenheit
Instances: 253
9.6.36 Transmission (Twin Disk)
This category applied only to proprietary PGNs from Twin Disk transmissions.
For the exact meanings of some of these parameters, please consult Twin Disk documentation.
9.6.36.1 Active Station
Displays the number (identity) of the control station currently controlling this transmission
Display: Digital
Instances: 253
9.6.36.2 Clutch Slip
Displays the current gear of the transmission (forward, neutral, or reverse)
Display: Gauge, Status Bars, Digital, Line Graph
Units: %
Instances: 253
9.6.36.3 Driveline Engaged
Displays whether the transmission is engaged or not.
Display: Indicator, Digital Counter, Digital Timer, Indicator Graph
Units: Yes | No
Instances: 253
9.6.36.4 Input Shaft Speed
Displays the rpm of the input shaft to the transmission
Display: Gauge, Status Bars, Digital, Line Graph
Units: RPM, RPM x 100
Instances: 253
9.6.36.5 Lock up Engaged
Displays whether the transmission lock up clutch on the torque converter is engaged or not.
Display: Indicator, Digital Counter, Digital Timer, Indicator Graph
Units: Yes | No
Instances: 253
9.6.36.6 Lockup Transition
Displays when the transmission is busy transitioning into the lock up state.
Display: Indicator, Digital Counter, Digital Timer, Indicator Graph
Units: Yes | No
Instances: 253
9.6.36.7 Max Power Enable
Displays when the transmission generates the Max Power flag.
Display: Indicator, Digital Counter, Digital Timer, Indicator Graph
Units: Yes | No
Instances: 253
9.6.36.8 Output Shaft Speed
Displays the rpm of the output shaft from the transmission
Display: Gauge, Status Bars, Digital, Line Graph
Units: RPM, RPM x 100
Instances: 253
9.6.36.9 Overspeed Enable
Displays when the transmission generates the Overspeed flag.
Display: Indicator, Digital Counter, Digital Timer, Indicator Graph
Units: Yes | No
Instances: 253
9.6.36.10 Progressive Shift Disable
Displays when progressive shifting has been disabled in the transmission.
Display: Indicator, Digital Counter, Digital Timer, Indicator Graph
Units: Yes | No
Instances: 253
9.6.36.11 Twin Disk Fault
Displays when the Twin Disk transmission generates a fault flag.
Display: Indicator, Digital Counter, Digital Timer, Indicator Graph
Units: OK | Warning | Fault
Instances: 253
9.6.37 Transmission Warning
For extra warnings please consult the above section on Twin Disk Transmissions. Some of the parameters from that section are duplicated here.
9.6.37.1 Check Transmission
Generally indicates some fault condition in the transmission that requires attention. Please consult the transmission manufacturer’s documentation for details.
Component Types: Indicator Light / Small Indicator Light / Digital Counter / Timer / Indicator Graph
Instances: 253
9.6.37.2 Low Oil Level
Generally indicates that the oil level in the transmission has fallen below some transmission-defined limit. Please consult the transmission manufacturer’s documentation for details.
Component Types: Indicator Light / Small Indicator Light / Digital Counter / Timer / Indicator Graph
Instances: 253
9.6.37.3 Low Oil Pressure
Generally indicates that the oil pressure in the transmission has fallen below some transmission-defined limit. Please consult the transmission manufacturer’s documentation for details.
Component Types: Indicator Light / Small Indicator Light / Digital Counter / Timer / Indicator Graph
Instances: 253
9.6.37.4 Over Temperature
Generally indicates that the operating temperature of the transmission exceeds some transmission-defined limit. Please consult the transmission manufacturer’s documentation for details.
Component Types: Indicator Light / Small Indicator Light / Digital Counter / Timer / Indicator Graph
Instances: 253
9.6.37.5 Sail Drive
Generally indicates that the sail driver mode in the transmission has been activated. Please consult the transmission manufacturer’s documentation for details.
Component Types: Indicator Light / Small Indicator Light / Digital Counter / Timer / Indicator Graph
Instances: 253
9.6.38 Vessel
9.6.38.1 Attitude
Displays the pitch of the vessel (rotation about the horizontal axis perpendicular to the ship’s keel) and the roll (rotation about the horizontal axis parallel to the ship’s keel).
Component Types: Attitude Indicator
Units: Degrees
Instances: 253
9.6.38.2 Longitudinal Speed, Ground Referenced
Displays the speed of the vessel in the direction of the bow, but referenced to the ground.
Component Types: Gauge, Status Bars, Digital, Line Graph
Units: km/h, knots, m/s
Instances: 253
9.6.38.3 Longitudinal Speed, Water Referenced
Displays the speed of the vessel in the direction of the bow, and referenced to the water. This would be the bow component of speed through water.
Component Types: Gauge, Status Bars, Digital, Line Graph
Units: km/h, knots, m/s
Instances: 253
9.6.38.4 Pitch
Displays the pitch of the vessel (rotation about the horizontal axis perpendicular to the ship’s keel)
Component Types: Digital, Line Graph
Units: Degrees
Instances: 253
9.6.38.5 Port Trim Tab
Displays the position of the vessel’s port trim tab
Component Types: Trim Bar Graph
Instances: 253
9.6.38.6 Roll
Displays the roll of the vessel (rotation about the horizontal axis parallel to the ship’s keel)
Component Types: Digital, Inclinometer, Line Graph
Units: Degrees
Instances: 253
9.6.38.7 Starboard Trim Tab
Displays the position of the vessel’s starboard trim tab
Component Types: Trim Bar Graph
9.6.38.8 Stern Speed, Ground Referenced
Displays the speed of the stern of the vessel referenced to the ground.
Component Types: Gauge, Status Bars, Digital, Line Graph
Units: km/h, knots, m/s
Instances: 253
9.6.38.9 Stern Speed, Water Referenced
Displays the speed of the stern of the vessel referenced to the water
Component Types: Gauge, Status Bars, Digital, Line Graph
Units: km/h, knots, m/s
Instances: 253
9.6.38.10 Transverse Speed, Ground Referenced
Displays the speed of the vessel perpendicular to the direction of the bow, but referenced to the ground.
Component Types: Gauge, Status Bars, Digital, Line Graph
Units: km/h, knots, m/s
Instances: 253
9.6.38.11 Transverse Speed, Water Referenced
Displays the speed of the vessel perpendicular to the direction of the bow, and referenced to the water
Component Types: Gauge, Status Bars, Digital, Line Graph
Units: km/h, knots, m/s
Instances: 253
9.6.38.12 Vessel Operating Mode
Displays the text of the Vessel Operating Mode
Component Types: Digital
9.6.39 Vessel Data Recorder
9.6.39.1 VDR Status
Displays the Status of the Vessel Data Recorder
Component Types: Digital
Instances: 253
Values: [ “Recording”, “Formatting”, “Erasing”, “No USB Flash Drive”, “Error”, “Initializing” ]
9.6.39.2 VDR Capacity
Display the capacity of the USB Flash Drive connected to the VDR.
Component Types: Digital
Units: GBytes
Instances: 253
9.6.39.3 VDR Memory Used
Display the amount of memory of the USB Flash Drive connected to the VDR that has been used.
Component Types: Digital
Units: GBytes
Instances: 253
9.6.39.4 VDR Memory Available
Display the amount of memory of the USB Flash Drive connected to the VDR that has not been used.
Component Types: Digital
Units: GBytes
Instances: 253
9.6.39.5 VDR Percent Used
Display the percentage of memory of the USB Flash Drive connected to the VDR that has been used.
Component Types: Digital
Units: Percent
Instances: 253
9.6.39.6 VDR Percent Available
Display the percent of memory of the USB Flash Drive connected to the VDR that has not been used.
Component Types: Digital
Units: Percent
Instances: 253
9.6.40 Video
9.6.40.1 Video
Video is not received on the NMEA 2000 bus. It is received on the Ethernet Bus.
Component Types: Video, Video with PTZ. In the Demo version only, an additional option is provided to look at a pre-recorded video clip.
Sources: Camera Sources are defined in the Camera Setup Screen, and are selected from a list presented in the Component Editor.
9.6.41 Watermaker
N2KView supports Sea Recovery (or equivalent) Watermakers, plus new Watermakers that transmit the NMEA 2000 Watermaker PGNs. If using a Watermaker that transmits the Sea Recovery proprietary PGN, only the Watermaker Operating Panel from the following list can be displayed.
9.6.41.1 Brine Water Flow
If supported by the Watermaker, this parameter displays the flow rate of the Brine.
Component Types: Gauge, Status Bars, Bar Graph, Digital, Line Graph
Units Imp Gal/h, Litre/hr, US Gal/h, Imp Gal/min, Litre/min, US Gal/min
Instances: Any, 253
9.6.41.2 Feed Pressure
If supported by the Watermaker, this component displays the pressure of the water feed into the Watermaker.
Component Types: Gauge, Status Bars, Bar Graph, Digital, Line Graph
Units kPa, Bar, PSI
Instances: Any, 253
9.6.41.3 Feed Pressure Status
If supported by the Watermaker, this component displays the status of the Feed Pressure Sensor.
Component Types: Indicator
Units: OK | Warning | Error
Instances: Any, 253
9.6.41.4 Filter Status
If supported by the Watermaker, this component displays the status of the Filter.
Component Types: Indicator
Units: OK | Warning | Error
Instances: Any, 253
9.6.41.5 Flush Mode Status
If supported by the Watermaker, this component displays ON when the Watermaker is busy flushing the system.
Component Types: Indicator
Units: OFF | ON | Error
Instances: Any, 253
9.6.41.6 Oil Change Indicator
If supported by the Watermaker, this component shows that you need to change the Oil in the Watermaker.
Component Types: Indicator
Units: OK | Warning | Error
Instances: Any, 253
9.6.41.7 Post-filter Pressure
If supported by the Watermaker, this component displays the pressure of the water after the filter.
Component Types: Gauge, Status Bars, Bar Graph, Digital, Line Graph
Units kPa, Bar, PSI
Instances: Any, 253
9.6.41.8 Pre-filter Pressure
If supported by the Watermaker, this component displays the pressure of the water before the filter.
Component Types: Gauge, Status Bars, Bar Graph, Digital, Line Graph
Units kPa, Bar, PSI
Instances: Any, 253
9.6.41.9 Product Solenoid Value
If supported by the Watermaker, this component shows the status of the solenoid valve feeding the treated water.
Component Types: Indicator
Units: Off | On | Error
Instances: Any, 253
9.6.41.10 Product Water Flow
If supported by the Watermaker, this parameter displays the rate at which purified water is being produced.
Component Types: Gauge, Status Bars, Bar Graph, Digital, Line Graph
Units Imp Gal/h, Litre/hr, US Gal/h, Imp Gal/min, Litre/min, US Gal/min
Instances: Any, 253
9.6.41.11 Product Water Temperature
If supported by the Watermaker, this parameter displays the temperature of the purified water.
Component Types: Gauge, Status Bars, Bar Graph, Digital, Line Graph
Units °C, °F
Instances: Any, 253
9.6.41.12 Run Time
This component displays the number of time that the Watermaker has been running.
Component Types: Digital
Units: hh:mm, mm:ss, hh:mm:ss
Instances: Any, 253
9.6.41.13 Salinity
If supported by the Watermaker, this parameter displays the salinity of the purified water.
Component Types: Gauge, Status Bars, Bar Graph, Digital, Line Graph
Units parts per million (ppm)
Instances: Any, 253
9.6.41.14 Salinity Status
If supported by the Watermaker, this component displays the status of the Salinity Sensor.
Component Types: Indicator
Units: OK | Warning | Error
Instances: Any, 253
9.6.41.15 System High Pressure
If supported by the Watermaker, this component displays the pressure of the water being fed into the Reverse Osmosis Filter, after the High Pressure Pump.
Component Types: Gauge, Status Bars, Bar Graph, Digital, Line Graph
Units kPa, Bar, PSI
Instances: Any, 253
9.6.41.16 System Status
If supported by the Watermaker, this component displays the status of the Watermaker as a system.
Component Types: Indicator
Units: OK | Warning | Error
Instances: Any, 253
9.6.41.17 Watermaker Operating State
If supported by the Watermaker, this component displays the state in which the Watermaker is operating.
Component Types: Digital
Units: Stopped | Starting | Running | Stopping | Flushing | Rinsing | Initiating | Manual Mode | Error
Instances: Any, 253
9.6.41.18 Watermaker Panel
This component displays the status of a Sea Recovery Watermaker on the system as a composite control.
Component Types: Watermaker
Instances: Any, 253
9.6.42 Wind
There are several different types of wind measurements. They are described in the following section.
9.6.42.1 Wind Direction
Component Types (Apparent): Wind Angle, Close Wind Angle
Component Types (Ground): Digital, Cardinal, North Up Rose
Component Types (True): Wind Angle
References: Apparent, Ground, True
Units: Beaufort, kilometers/hour, nautical miles/hour, miles/hour
9.6.42.1.1 Apparent
Displays the angle and speed of the wind relative to the vessel center line as it appears to an observer on the deck of a moving vessel (does not subtract out the speed of the vessel)
9.6.42.1.2 Ground
Displays the angle and speed of the wind relative to true or magnetic north (depending on the unit setting of the ‘heading” parameter – see Section 9.4.12.2.5 for details) relative to a stationary observer, calculated using heading, course over ground (COG) and speed over ground (SOG)
9.6.42.1.3 True
Displays the angle and speed of the wind relative to the vessel centerline (vessel’s speed is subtracted from apparent wind direction), calculated using speed through water (STW) or speed over ground (SOG) depending on the unit setting of the “Wind True Vessel Referenced” parameter under “Global Settings” on the “Units” screen. (see Section 9.4.12.2.6 for details).
9.6.42.2 Speed
References: Apparent, Ground, True
Component Types (Apparent): Digital, Wind Angle, Line Graph
Component Types (Ground): Digital
Component Types (True): Digital, Wind Angle
Units: Beaufort, kilometers/hour, nautical miles/hour, miles/hour
9.6.43 Xantrex
This category displays values from proprietary PGNs from Xantrex converters.
9.6.43.1 AC Current
This component displays the AC Current being drawn or supplied by the inverter.
Component Types: Gauge, Status Bars, Bar Graph, Digital, Line Graph
Units A
Instances: 253
Connections: 30
9.6.43.2 AC Frequency
This component displays the frequency of the AC Voltage being drawn or supplied by the inverter.
Component Types: Gauge, Status Bars, Bar Graph, Digital, Line Graph
Units Hz
Instances: 253
Connections: 30
9.6.43.3 AC Power
This component displays the AC power being drawn or supplied by the inverter.
Component Types: Gauge, Status Bars, Bar Graph, Digital, Line Graph
Units 0..1, no units
Instances: 253
Connections: 30
9.6.43.4 AC Power Factor
This component displays the AC Power Factor of the power being drawn or supplied by the inverter.
Component Types: Gauge, Status Bars, Bar Graph, Digital, Line Graph
Units A
Instances: 253
Connections: 30
9.6.43.5 AC Reactive Power
This component displays the AC Reactive Power being drawn or supplied by the inverter.
Component Types: Gauge, Status Bars, Bar Graph, Digital, Line Graph
Units A
Instances: 253
Connections: 30
9.6.43.6 AC Voltage
This component displays the AC Voltage being supplied to or generated by the inverter.
Component Types: Gauge, Status Bars, Bar Graph, Digital, Line Graph
Units A
Instances: 253
Connections: 30
9.6.43.7 Converter Low DC Voltage
This is an error out from the converter if the battery voltage feeding the inverter falls too low.
Component Types: Indicator
Units: OK | Warning | Error
Instances: 253
Connections: 30
9.6.43.8 Converter Operating State
This displays the operating state of the converter.
Component Types: Digital
Units: Off | Low Power Mode | Fault | Bulk | Absorption | Float | Storage | Equalize | Pass Through | Inverting | Assisting
Instances: 253
Connections: 30
9.6.43.9 Converter Overload
This is an error out from the converter if it is overloaded.
Component Types: Indicator
Units: OK | Warning | Error
Instances: 253
Connections: 30
9.6.43.10 Converter Ripple State
This is an error out from the converter if the amount of ripple is excessive.
Component Types: Indicator
Units: OK | Warning | Error
Instances: 253
Connections: 30
9.6.43.11 Converter Temperature
This component displays the internal temperature of the converter.
Component Types: Gauge, Status Bars, Bar Graph, Digital, Line Graph
Units °C, °F
Instances: 253
Connections: 30
10 Alerts
10.1 Overview
The Alerts Module of N2KView contains a comprehensive alerts capability allowing an alert to be issued when a parameter value crosses the threshold that you choose. You may set alerts for almost any parameter that you can view with N2KView.
N2KView alerts work with multiple instances of N2KView Stations and DSM150 Displays ( http://www.maretron.com/products/dsm150.php ) / DSM250 Displays ( http://www.maretron.com/products/dsm250.php ) ) / DSM410 Displays ( http://www.maretron.com/products/dsm410.php ) and DSM570 Displays ( http://www.maretron.com/products/dsm570.php ). You can define alerts as being either local (appearing only on the N2KView Station on which you defined them) of global (appearing on all N2KView Stations on the network that are equipped with a Alerts Module). A global alert can be accepted or cancelled by any N2KView Station having a Alerts Module or DSM150/DSM250/DSM410/DSM570 on the network.
When an alert occurs, it is displayed on the Alert Status Bar, which is always visible in a reserved area at the bottom of the N2KView window. You may click on the alert in the Alert Status Bar to take action on it, or you may switch to the Alerts tab to view more detailed information about the cause of the alert. A long press on the Alert Status bar will display the detail screen on the alert, which includes some history about the alert and may include instructions on how to clear the alert.
N2KView can also perform the following actions when an alert becomes active:
· Send Alert Messages to other N2KView programs or DSM150/DSM250/DSM410 Displays connected on the same bus, or to remote N2KView programs connected over Ethernet.
· Sound a remote annunciator, such as Maretron’s ALM100 Alarm Module, on the NMEA 2000 bus. (http://www.maretron.com/products/alm100.php) One or more channels of Maretron’s DCR100 Direct Current Module (http://www.maretron.com/products/dcr100.php) may also be triggered to drive an external alarm,
· Sound the speaker on the PC.
· Send an e-mail message
· Send a SMS (Text Message) to a cell phone. (requires a SMS100 Module)
· Activate switches
10.2 Alert Concepts
10.2.1 Alert Types
Alerts and their behavior are defined by the International Marine Organization (IMO) in the Code on Alarms and Indicators as follows:
An alert is a signal to a user that there is either an alarm or warning condition requiring user intervention.
There are two classes of alerts, which are distinguished by their severity:
· Alarm – An alarm is a type of alert announcing a condition requiring immediate attention or user intervention. Alarms are shown in red, and always appear to the left of warnings in the Alert Ticker and above warnings on the Alert Screen.
· Warning – A warning is a type of alert announcing a condition requiring non-immediate attention for precautionary reasons. Warnings are shown in yellow, and always appear to the right of Alarms in the Alert Ticker and below alarms on the Alert Status Screen.
10.2.2 Alert Terminology
The following alert terminology is used in N2KView.
· Accept – The user action of acknowledging the existence of an alert. Alerts are only accepted when they are Active (deprecated in favor of Acknowledge)
· Cancel – The user action of removing an alert from the list of displayed alerts. Alerts may only be cancelled if the condition causing the alert has been removed. (deprecated in favor of Acknowledge)
· Condition – An alert may be limited by a condition to prevent false triggering
· Acknowledge – From N2KView version 3.6.2, the terms Accept and Cancel have been replaced by Acknowledge to conform to changes in the IMO code on Alarms and Indicators. An Alert must be Acknowledged by the user, and this action can happen when the Alert is Active or the condition causing the alert has been removed without the Alert being previously Acknowledged.
· Clear – An alert is cleared when the condition causing the alert is removed.
· Trigger – An alert is triggered when the condition monitored by the alert is met.
10.2.3 Alert Priority
Each alert has a priority which you can define, ranging from 0 to 4000 with 0 the highest or most important priority and 4000 the lowest or least important priority. Alerts can be ordered many different ways on the Alerts Screen. For example, ordering by priority is done by clicking on the column header entitled Priority or listing the log entry chronologically is done by clicking on the column header entitled time. Data can be sorted on any column by clicking the column heading.
10.2.4 Vessel Alert Operating Modes
You can configure alerts to operate in one or more vessel operating modes, 1) disabled, 2) moored, 3) underway, or 4) anchored. This allows you to easily enable or disable groups of individual alarms depending on the vessel’s operating mode. The Vessel Alert Operating Mode is set under the Alerts Setup tab.
· Disabled – All alerts are disabled. This mode should be used when the vessel is in storage, drydock, or otherwise out of operation.
· Moored – This mode is used when the vessel is secured to a structure that is permanently attached to the ground like a pier, wharf, dock, or mooring buoy.
· Underway – This mode is used when the vessel is not moored nor anchored.
· Anchored – This mode is used when the vessel is secured to the sea floor with an anchor.
· User 1 – This is a user defined mode.
· User 2 – This is a user defined mode.
10.2.5 Alert States
Alerts exist in one of five states with transitions defined by the following state diagram.
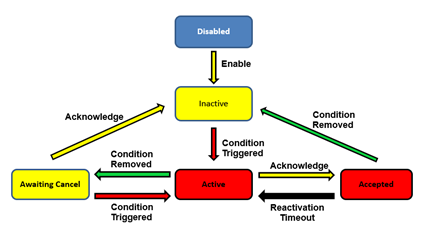
· Disabled – A Disabled Alert is an alarm or warning that has yet to be enabled or activated. In this state, no action will be taken regardless of the value of the monitored parameter. An Alert may be disabled by marking it as Disabled, or by setting the Vessel Operating Mode to a Mode where the Alert is not enabled. A Disabled Alert May be enabled in which case it transitions to the Inactive state
· Inactive – An Inactive alert is an alarm or warning that has been enabled, but the condition causing the alert is not present. If the alert condition becomes true, the alert will become Active. An Inactive alert may be disabled, which causes it to transition to the Disabled state. New alerts are created in the Inactive State.
· Active – An Active alert is an alarm or warning where the condition to trigger the alert has been met, is still present, and the operator has not acknowledged the alert. An active alert is indicated by a flashing indicator within the Alert Status Bar and on the Alerts Screen. Also, annunciators that are programmed to sound when this alert is active will be sounding during this state, and any e-mail messages that are programmed to be sent for this alert will be sent when this state is entered. An active alert can be acknowledged y the user (causing it to become an Accepted Alert) or disabled by the user (causing it to become a Disabled Alert). If the condition causing the alert is rectified, the alert transitions to the Awaiting Cancel state.
· Accepted – An Accepted alert is an alarm or warning which was Active and has been acknowledged by the user. An Accepted alert is indicated by a solid indicator in the Alert Status Bar and a solid color on the Alert Status Screen; annunciators are silenced. Normally, an alert is a serious matter that requires immediate attention and requires a deliberate attempt to remove the condition that caused the alert. Sometimes it isn’t practical to immediately remove the condition that caused the alert; acknowledging the alert will silence the annunciators while the appropriate user action is being taken.
To prevent an alert that has accepted by the user from being forgotten, an Accepted alert will transition back to being Active after a period of time set by the user.
If the condition causing the alert is rectified (cleared), the alert will transition to the Inactive state.
You may disable the alert at this time, causing it to become a Disabled Alert,
10.2.6 Available Alert Classes
N2KView has several classes of alerts. Different alert classes are available depending on the parameter for which an alert is being configured.
· Low Alert – The alert will become active if the monitored value drops below the value in this alert for longer than the time specified in the Set Delay field.
· High Alert – The alert will become active if the monitored value rises above the value specified in this alert for longer than the time specified in the Set Delay field.
· Data Unavailable Alert – The alert will become active if the monitored value is not received, or is received but with a value of “Data Not Available”, for longer than the time specified in the Set Delay field.
· On Alert – The alert will become active if the monitored switch or flag becomes “ON” for longer than the time specified in the Set Delay field.
· Off Alert – The alert will become active if the monitored switch or flag becomes “OFF” for longer than the time specified in the Set Delay field.
· Entry On Alert – The alert will become active if the monitored switch or flag becomes “ON” for longer than the time specified in the Set Delay field. Once the Set Delay period has been entered, the alert will always transition to the Active state, and removing the condition will not stop this process.
It is designed for door entry. If a door is opened, the alert will trigger after the delay period unless it is disabled, typically by the user changing the Vessel Operating Mode to a mode that has the alert disabled. Closing the door is not sufficient to prevent the alert from sounding. If the User 1 Vessel Operating Mode is set as a typical “Away” mode with all the doors and windows alarmed, then the user would change the mode to “Moored” immediately on entering the boat, and the alert will be disabled.
· Entry Off Alert – See Entry On Alert above, but alert will become active if the monitored switch or flag becomes “OFF” for longer than the time specified in the Set Delay field.
· Tripped Alert – The alert will become active if the monitored circuit breaker becomes “Tripped” for longer than the time specified in the Set Delay field.
· Disconnected Alert – The alert will become active if the connection to the server is lost for more than the time specified in the Set Delay field.
· Course Alert – The alert will become active if the monitored course differs from the Reference Direction by more than the Offset COG Set Point for longer than the time specified in the Set Delay field.
· GPS Quality Alert – The alert will become active if the GPS Quality drops below the level set in the GPS Quality Alert Set field for longer than the time specified in the Set Delay field.
· Outside Radius Alert – The alert will become active if the distance between the current GPS position and the Reference Latitude and Longitude rises above the value in the Outside Radius Alert Set field for longer than the time specified in the Set Delay field.
· Inside Radius Alert – The alert will become active if the distance between the current GPS position and the Reference Latitude and Longitude falls below the value in the Outside Radius Alert Set field for longer than the time specified in the Set Delay field.
· Anchor Watch Alert – The alert will become active if the distance between the current GPS position and the Reference Latitude and Longitude rises above the value in the Anchor Watch Alert Set Point field for longer than the time specified in the Set Delay Field.
· Direction Alert – The alert will become active if the monitored course differs from the Reference Direction by more than the Offset Wind Direction Set Point for longer than the time specified in the Set Delay field.
· Timer Alert – The alert will become active when the time reaches the time specified in the Alarm Time field, and thereafter after the intervals specified in the Repeat Interval field.
10.2.7 Alert Conditions
Version 5.0.5 of N2KView introduces Conditional Alerts. If a condition is added to an alert, then the condition must be met as well as the data for the class of alert.
This is best explained by way of an example: A low oil pressure alert for an engine will sound any time the oil pressure drops below the critical value. But when the engine is turned off, the oil pressure will also drop below that critical value and the alert will sound although this is normal operation. To prevent this false alert, we can add a condition to the alert that the engine RPM needs to be above 400 RPM so that the alert will not sound when the engine is switched off.
One of the following conditions may be added to any alert.
· Low Condition – The condition will be met if the monitored value drops below the value in this condition.
· High Condition – The condition will be met if the monitored value rises above the value in this condition.
· Active Condition – The condition will be met if the monitored switch or flag is ON.
· GPS Status Condition – The condition will be met if the GPS status is at least as good as the value in this condition.
10.3 Viewing Alerts
This section describes the different ways in which alerts may be viewed.
10.3.1 The Alert Status Bar
The Alert Status Bar is a small part of the overall N2KView screen that is always present when the Alerts Module has been licensed, and is shown along the entire bottom of the screen (the Alert Status Bar is even present in authoring mode). The Alert Status Bar shows the description and location of each alert within a text box.
The alerts are displayed in a left to right order with more important alerts to the left. Generally, the order is: Active and Accepted Alarms, Active and Accepted Warnings, Awaiting Cancel Alarms, and Awaiting Cancel Warnings. Within these groups alerts are ordered in increasing priority number.
An example of the Alert Status Bar is shown below.
![]()
Figure 113 – Alert Status Bar
The number of alerts displayed on the Alert Status Bar depends on the size of the screen. Should more alerts be required to be displayed than can fit on the Alert Status Bar, the line above the alerts will change to a flashing red.
![]()
Figure 114 – Over Full Alert Status Bar
![]() Active
Alarms appear as flashing red indicators. Clicking on this indicator will
cause the alarm to become an Accepted Alarm, and the indicator will change to
solid red.
Active
Alarms appear as flashing red indicators. Clicking on this indicator will
cause the alarm to become an Accepted Alarm, and the indicator will change to
solid red.
Accepted Alarms appear as solid red indicators.
![]() Awaiting
Cancel Alarms appear as dark indicators with a red border and an “x” on the
right hand side of the indicator. When you click on this indicator, the alarm
will become Inactive and will be removed from the Alert Status Bar.
Awaiting
Cancel Alarms appear as dark indicators with a red border and an “x” on the
right hand side of the indicator. When you click on this indicator, the alarm
will become Inactive and will be removed from the Alert Status Bar.
Inactive Alarms and Disabled Alarms do not appear on the Alert Status Bar.
![]() Active
Warnings appear as flashing yellow indicators. Clicking on this indicator
will cause the warning to become an Accepted Warning and the indicator will
change to solid yellow.
Active
Warnings appear as flashing yellow indicators. Clicking on this indicator
will cause the warning to become an Accepted Warning and the indicator will
change to solid yellow.
Accepted Warnings appear as solid yellow indicators.
![]() Awaiting
Cancel Warnings appear as dark indicators with a yellow border and an “x”
on the right hand side of the indicator. When you click on this indicator, the
alert will become inactive and the indicator will disappear from the Alert Status
Bar.
Awaiting
Cancel Warnings appear as dark indicators with a yellow border and an “x”
on the right hand side of the indicator. When you click on this indicator, the
alert will become inactive and the indicator will disappear from the Alert Status
Bar.
Inactive Warnings and Disabled Warnings do not appear on the Alert Status Bar.
The vessel’s Operating Mode appears at the extreme right-hand side of the Alert Status Bar.

Underneath the Vessel Operating Mode the following messages may also be displayed in yellow to indicate that the alert configuration is in an unusual state.
Independent Mode
The operating mode of this terminal will not change as the vessel operating mode is change on other terminals. I.e. this terminals operating mode is independent of the vessel operating mode. This is set in the Alert Options dialog (10.4.1).

Global Alerts Disabled
If the same configuration is loaded on more than one terminal, each of these terminals will detect the same alert condition and generate an alert. This will result in multiple alerts being displayed on all the terminals for the same event. To prevent this, global alerts may be disabled by the user on all but one terminal in the Operating Mode dialog (0).
If there is no terminal on the network with Global Alerts enabled, then important alert events will not be generated. To warn the user of this condition all the terminals will show “Global Alerts Disabled”. Enabling Global Alerts on one terminal will suppress this message.

Note: This message does not mean that “Global Alerts are disabled on this terminal” – it means that “Global Alerts are disabled on all terminals, including this terminal”.
10.3.2 Alerts Tab
The Alerts Tab appears along the top of the N2KView main screen just as any other favorite screen tab except that the Alerts Tab always appears in the upper left tab position. If the Alerts Module is licensed, pressing or left clicking on the Alerts Tab causes the Alerts Screen to appear.
![]()
Figure 115 – Alerts Tab
10.3.3 Alert Status Screen
The Alert Status Screen is a tabular listing of alerts in log form where you can view all pending and past alerts. Extensive sorting capabilities allow you to quickly find alerts of interest. An example of the Alert Status Screen is shown below.
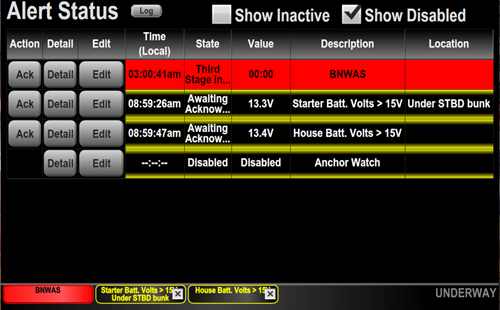
Figure 116 – Alert Status Screen
The Alert Status Screen consists of a table with several rows. Each row of the table describes an alert with as much detail as possible for the screen width. Some columns are removed for smaller screens. By default, Inactive Alerts and Disabled alerts are not shown. You may check the boxes labeled “Show Inactive” or “Show Disabled” at the top of the Alert Status Screen to show inactive and disabled alerts, in addition to the alerts normally shown.
The Log button at the top of the screen will display a time-ordered log of all the alert activity for the past 60 days. See .
The columns of the table may be resized by “grabbing” the bar to the right of the column heading and dragging it to the desired position. Pressing or clicking on the column heading will sort the entries in the table in either increasing or decreasing order of the column chosen. You cannot sort on the Action Column, the Edit Column or the What Happened column.
The rows in the table are colored and flash or remain solid in color according to the state of the alert described by the row. Please refer to Section 0 for a description of how the appearance of the row changes with the alert state.
The columns of the table give detail on the alerts displayed. On narrow screens not all the columns will be displayed.
10.3.3.1 Action
This column contains an Acknowledge (Ack) button when the Alert is Active or Awaiting Cancel. If the alert is Active, pressing the button will cause the alert to become an “Accepted Alert”. If the alert is Accepted, there will be no entry in this column. If the alert is Awaiting Cancel, pressing this button will cause the alert to become an Inactive Alert, and it will disappear from the table unless the “Show Inactive” box is checked at the top of the screen. If the alert is Inactive or Disabled, there will be no entry in this column.
10.3.3.2 Detail
Pressing the Detail button will open the following dialog, showing a lot of detail and history of the alert.
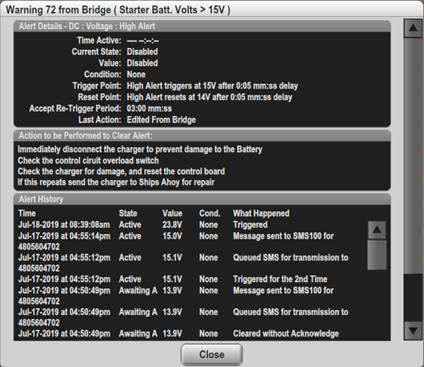
Figure 117 – Alert Detail Dialog
The title of the dialog contains the Priority, Description and Location of the Alert.
The Alert Details section shows the current state of the alert, the current value of the parameter being monitored, the current state of the Condition, and a description of the alert trigger and reset values.
If entered, it will also contain details of what actions should be taken to clear the alert.
If the Alert has been generated due to a tripped Breaker, the Breaker will be displayed in the dialog. This enables the user to quickly reset the Breaker without further navigation through the screens.
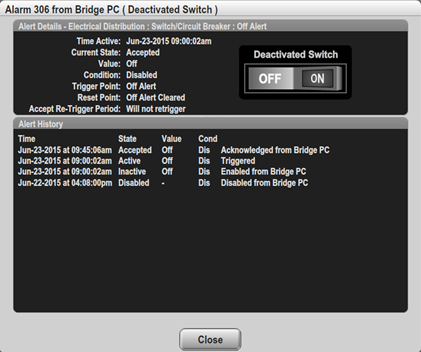
The last 40 major Alert transitions are stored in the Alert History.
10.3.3.3 Edit
If the alert is defined in this instance of N2KView, this column will contain an Edit button. Pressing on or clicking the button will open the Alert Edit dialog and will allow you to change the configuration of this alert. If a password has been set in the Password Dialog (see 0), then you will be requested to enter this password to gain access to the Alert Edit Dialog.
10.3.3.4 Time
The time column will contain the time at which the alert first went Active. Pressing the header of the Time column will change the Date and Time between Local Time and UTC.
10.3.3.5 Date
The time column will contain the date at which the alert first went Active. Pressing the header of the Date column will change the Date and Time between Local Time and UTC.
10.3.3.6 State
The entry in this column will describe the state of the alert. Please refer to Section 0 for a description of the different alert states.
10.3.3.7 Source
The entry in this column reflects the Label of the N2KView instance (see section 9.4.6.1.1) on which the alert is configured. You may accept or cancel alerts from any N2KView instance that has the Alerts Module licensed, but you may only change the configuration of an alert on the instance of N2KView on which it was originally configured.
10.3.3.8 Value
The entry in this column shows the value of the monitored parameter in real time. For time alerts, this column shows the time remaining; for distance alerts, this column show the distance between the current boat position and the reference position.
10.3.3.9 Priority
The entry in this column describes the priority you assigned to the alert. “0” is the highest priority, and “9999” is the lowest. Sorting the table on priority will place the alarms above the warnings, and then sort in priority order within these groups.
10.3.3.10 Description
The entry in this column reflects the contents of the Description field in the Alerts Editor for this alert.
10.3.3.11 Location
The entry in this column reflects the contents of the Location field in the Alerts Editor for this alert.
10.3.3.12 What happened
The entry in this column summarizes the most recent change in the alert status.
10.3.4 Alert Log for all Alerts
This alert log is a time-ordered log of all the alert activity stored in the system. N2KView stores alert activity for 60 days, and you can choose to display some of all of the entries.
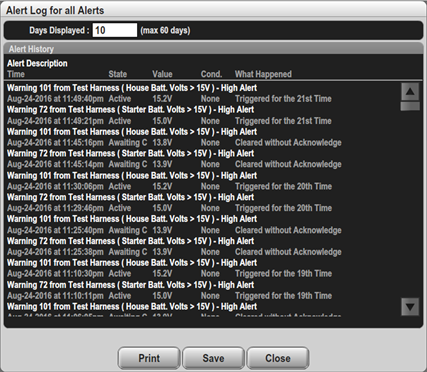
10.3.4.1 Print
On a PC, you may choose to print this table using the print services of the PC.
10.3.4.2 Save
Pressing the Save button will save the table to disk as a .csv file, which can then be imported into a program such as Excel. On Maretron’s MBB or TSM products, this button will be disabled if there is not a USB flash drive plugged in to the unit to receive the data.
10.3.4.3 Close
Closes the dialog.
10.4 Alerts Setup Sub-Menu
Pressing the Alerts Setup button on the Commands & Settings dialog will display the Alerts Setup Sub-Menu.
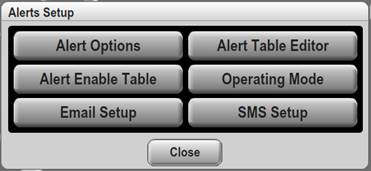
If Alerts are not licensed, the Alerts Setup button will appear semi-transparent, and will not respond to pressing or clicking.
10.4.1 Alert Options
Pressing the Alert Options button will open the Alert Options dialog.
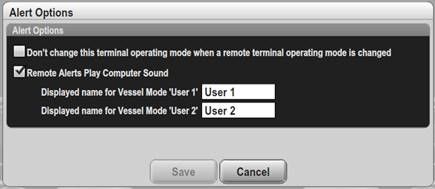
Don’t change this terminal operating mode when a remote terminal operating mode is changed – By default, the Vessel Operating Modes of all the N2KView systems on or off the boat are synchronized. Change one terminal to Underway, and the others also change. However, there may be instances where this behavior is undesirable. For example, if you have a N2KView computer in the Engine Room with its own set of Alerts that need to operate independently of the other terminals, then this box should be checked.
If this box is checked, the words “Independent Mode” will be displayed in the Alert Status Bar (10.3.1) in yellow.

Remote Alerts Play Computer Sound – When Alerts are received from another N2KView or DSM250 Alert Source, the computer sound will beep while the Alert is in the Active state if this box is checked.
Displayed Name for Vessel Mode User 1 – From version 5.0.15 the user can set the name that it displayed in the Alert Status bar for the User 1 Vessel Operating Mode to a more meaningful value, such as “Away” – or if you are not using this feature you can set to blank.
Displayed Name for Vessel Mode User 2 – From version 5.0.15 the user can set the name that it displayed in the Alert Status bar for the User 1 Vessel Operating Mode to a more meaningful value, such as “Locked” – or if you are not using this feature you can set to blank.
10.4.2 Alert Table Editor
Pressing Alert Table Editor will open the the Alert Table Editor to allow you to create new alerts or delete or re-configure existing alerts.
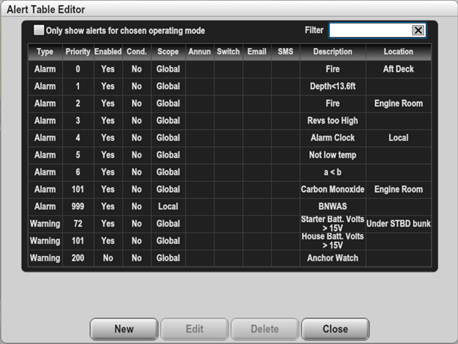
Figure 118 – Alert Table Editor
Only show alerts active in the chosen mode – If this is checked, then the alerts shown in the Alert Table will be limited to those active in the chosen Operating Mode.
Filter – Enter some text to limit the number of lines in the table. This helps you find a set of relevant alerts quickly. Both the Description and Locations are searched. The search is case-insensitive.
Alert Table – This table lists all the alerts defined in this instance of N2KView. Clicking on a row in the table will select an alert for editing or deletion. Double clicking on a row in the table will open the Alert Editor for that alert.
The Enabled column shows if the Alert is enabled in the chosen Operating Modem and has itself is enabled.
The Cond column shows if the condition associated with the alert has been met.
The Annun, Email, and SMS columns give a quick overview of which alerts are configured to sound annunciators, send emails, and send Text Messages in the current operating mode.
New – Click this button to create a new alert. A dialog will appear allowing you to select a parameter and alert class, and the appropriate Alert Editor will appear, letting you configure the new alert.
Edit – Clicking this button causes the Alert Editor to appear for the selected alert.
Delete – Clicking this button causes the selected alert to be permanently deleted. A warning dialog is displayed. Pressing the Delete button on the keyboard will have the same effect.
Save – Clicking this button causes the new Alert Operating Mode to be Set and then Alerts Setup Dialog to be closed.
Cancel – Clicking this button causes the Alerts Setup Dialog to be closed without changing the Alert Operating Mode.
10.4.3 Alert Enable Table
Pressing Alert Enable Table will open the the Alert Enable Table Dialog to allow you to quickly view, enable and disable existing alerts in the different Vessel Operating Modes.
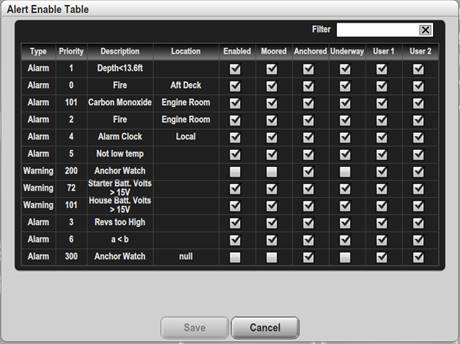
Figure 119 – Alert Table Editor
Filter – Enter some text to limit the number of lines in the table. This helps you find a set of relevant alerts quickly. Both the Description and Locations are searched. The search is case-insensitive.
Alert Table – This table lists all the alerts defined in this instance of N2KView. The checkboxes may be changed directly on the table, and will show a red box if they are different from that stored in the database..
The Enabled column shows if the Alert is enabled. Alerts that are not enabled will not be enabled in any Vessel Operating Mode.
The Moored column shows if the alert will be enabled when the Vessel Operating Mode is set to Moored.
The Anchored column shows if the alert will be enabled when the Vessel Operating Mode is set to Anchored.
The Underway column shows if the alert will be enabled when the Vessel Operating Mode is set to Underway.
The User 1 column shows if the alert will be enabled when the Vessel Operating Mode is set to User 1.
The User 2 column shows if the alert will be enabled when the Vessel Operating Mode is set to User 2.
Save – Clicking this button causes all the alerts to be updated with the changes and then Alert Enable Table dialog to be closed.
Cancel – Clicking this button causes the Alert Enable Table Dialog to be closed without making any changes.
10.4.4 Alert Editor
You initialize an alert by defining its parameters using the Alert Editor. Different alert classes will show different Trigger Configurations, and different parameters will have different parameter sections.
An example of an Alert Editor is shown below:
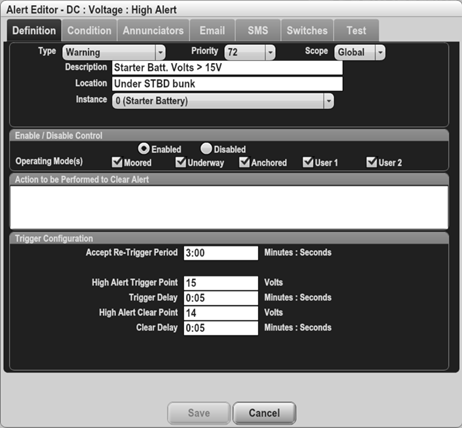
Figure 120 – Alert Editor Example
10.4.4.1 Definition Tab
10.4.4.1.1 Definition Section

Figure 121 – Alert Editor – Definition Section
The Definition Section of the Alert Editor is located at the top of the Definition tab of the Alert Editor and contains the description of the alert, and the parameter that is to be monitored.
10.4.4.1.1.1 Type

In this field, you may classify the alert as either an Alarm or a Warning (see Section 10.2.1 for details).
10.4.4.1.1.2 Priority
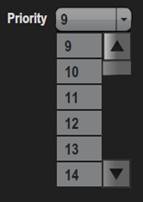
Here, you program a priority for the alert that allows you to rank it in importance compared to other alerts. The priority value can range from 0 to 4000, with 0 being the most important. N2KView will ensure that every alert has a unique priority number by omitting used priorities from the drop down list. You can have an Alarm and a Warning with the same Priority. Implicitly, all Alarms have a higher Priority than all Warnings. (i.e. Alarm 567 has a higher Priority than Warning 0.)
10.4.4.1.1.3 Scope

This field allows you to determine whether the alert will appear only on the instance of N2KView where it is defined (Local) or on all instances of N2KView on the network with an Alerts License (Global).
10.4.4.1.1.4 Description
![]()
You may type here a text description of the alert. This Description will be displayed on the Alarm Status Bar as a label for the alert, and will also appear in the description column on the Alerts Screen. This field must be filled in.
10.4.4.1.1.5 Location
![]()
You may type here a location of the alert. This location will be displayed on the Alarm Status Bar as part of the label for the alert, and will also appear in the “Location” column on the Alerts Screen. This field is optional.
10.4.4.1.1.6 Source
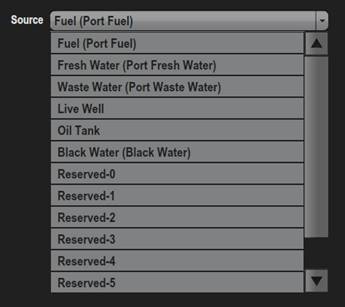
On parameters that have multiple sources, such as tanks, this field allows to select the source of the data. If label data is present on the bus for this parameter, it will be appended to the source name in parenthesis.
This field may not always be present.
10.4.4.1.1.7 Reference

On parameters that have multiple references, such as wind, this field allows to select the reference of the data.
This field may not always be present.
10.4.4.1.1.8 Indicators / Circuit Breakers
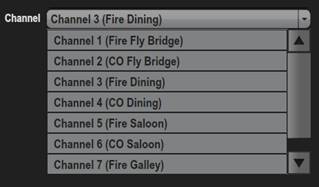
Figure 122 – Channel Drop Down List
For indicator channels and Circuit Breakers, this field allows you to select the channel field in the message that relates to the channel or breakers you want to monitor. If a label has been stored in the transmitting module, this will be displayed in parenthesis after the channel number.
This field may not always be present.
10.4.4.1.1.9 Instance
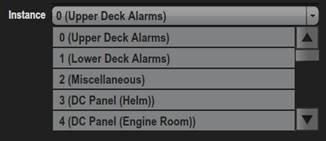
Figure 123 – Instance Drop Down List
This combo box identifies the instance number of the device to which the alert applies. The instance number may be chosen by pressing the small arrow to the right of the number, and selecting from the list of options that drops down. If a label has been stored in the transmitting module, this will be displayed in parenthesis after the channel number.
This field may not always be present.
10.4.4.1.2 Enable / Disable Control

The Enable / Disable Control section of the Alert Editor is located in the middle of the Alert Editor and contains the controls to enable and disable the alert.
10.4.4.1.2.1 Enabled / Disabled
In this field, you may globally enable or disable this alert from functioning. Selecting Enabled will automatically deselect Disabled and vice versa. Changing an Active or Accepted alert from Enabled to Disabled will show a warning. Disabling an alert here will take precedence over all other enabling / disabling actions.
10.4.4.1.2.2 Operating Mode(s)
In this field, you may choose in which vessel operating modes, Moored, Underway, Anchored, User 1, or User 2, this alert is enabled. You may choose any or all of these modes. The default is to have all five modes enabled. If the alert is Active or Accepted (i.e. the condition causing the alert is still present) and the check box for the current operating mode is disabled, a warning will be shown.
10.4.4.1.3 Action to be Performed to Clear Alert

This is a free format text field that may be displayed when an alert is triggered with instructions on what to do to clear the alert. It will be displayed in the Alert Detail Dialog. (see section 10.3.3.2)
10.4.4.1.4 Trigger Configuration
Because each alert type has a different trigger configurations layout, each alert type is presented in a different section.
10.4.4.1.4.1 High Alert
A high alert is used to signal you when a parameter value rises above a threshold you determine. For example, you can set an alert to occur whenever the freezer temperature rises above 0°C.
Description
A high alert and associated diagram are shown in the figure below.
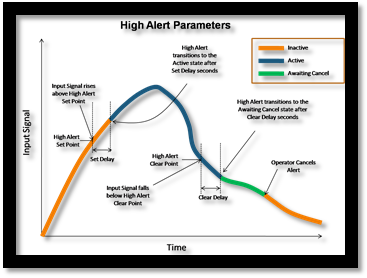
Figure 124 – High Alert Parameters
A high alert is triggered (i.e. becomes an active alert) once an input signal has risen above the High Alert Set Point and the Set Delay time has elapsed. If the Set Delay is set to zero, then the alert is immediately triggered once the input signal rises above the High Alert Set Point. The Set Delay is used to reduce false or spurious alerts. As an example, setting the Set Delay to 5 seconds will eliminate any temporary transitions of the input signal above the High Alert Set Point lasting less than 5 seconds from triggering an alert.
Once the alert is triggered, it becomes an active alert. An alert remains active until
· The input signals falls below the High Alert Clear Point and the Clear Delay time has elapsed. If the Clear Delay is set to zero, then the alert immediately transitions to the Awaiting Cancel once the input signal falls below the High Alert Clear Point (as shown in the example above).
· The user accepts the alert in which case it transitions into the Accepted state.
The Clear Delay is used to reduce false or spurious alerts.
Trigger Configuration

Figure 125 – Trigger Configuration – High Alert
Accept Re-trigger Period – When you accept an alert, it will change to the “Accepted” state, and annunciators that are sounding for that alert will stop sounding. If the condition which caused the alert remains true after the amount of time in this field, the alert will return to the “Active” state, and annunciators will begin sounding again for that alert. The value is entered as minutes:seconds. If only one number is entered, it will be interpreted as seconds.
If a value of 0:00 is entered, then the alert will never re-trigger.
High Alert Trigger Point – If the value of the parameter being monitored rises above the value in this field, the alert will become active.
Trigger Delay – The parameter being monitored must rise above the High Alert Trigger Point value for longer than the time in this field in order for an alert to become active. This can be used to prevent false alerts caused by parameter values that briefly have a value that would cause an alert but quickly return to the normal value range. The value is entered as minutes : seconds. If only one number is entered, it will be interpreted as seconds.
High Alert Clear Point – If the alert is active and the parameter value falls below the value in this field, the alert will become inactive.
Clear Delay – The parameter being monitored must fall below the High Alert Clear Point value for longer than the time in this field in order for the alert to become inactive. The value is entered as minutes : seconds. If only one number is entered, it will be interpreted as seconds.
10.4.4.1.4.2 Low Alert
A low alert is used to signal you when a parameter value falls below a threshold you determine. For example, you can set an alert to occur whenever the port engine oil pressure rises falls below 40 PSI.
Parameters
A low alert and associated diagram are shown in the figure below.
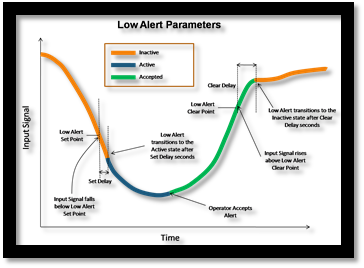
Figure 126 – Low Alert Parameters
A low alert is triggered (i.e. becomes an active alert) once an input signal has dropped below the Low Alert Set Point and the Set Delay time has elapsed. If the Set Delay is set to zero, then the alert is immediately triggered once the input signal drops below the Low Alert Set Point. The Set Delay is used to reduce false or spurious alerts. As an example, setting the Set Delay to 5 seconds will eliminate any temporary transitions of the input signal above the Low Alert Set Point lasting less than 5 seconds from triggering an alert.
Once the alert is triggered, it becomes an active alert. An alert remains active until:
· The input signals rises above the Low Alert Clear Point and the Clear Delay time has elapsed. If the Clear Delay is set to zero, then the alert immediately becomes inactive once the input signal falls below the Low Alert Clear Point. The Clear Delay is used to reduce false or spurious alerts.
· The user accepts the alert (as shown in the example above).
Trigger Configuration

Figure 127 – Trigger Configuration – Low Alert
Accept Re-trigger Period – When you accept an alert, it will change to the “Accepted” state, and annunciators that are sounding for that alert will stop sounding. If the condition which caused the alert remains true after the amount of time in this field, the alert will return to the “Active” state, and annunciators will begin sounding again for that alert.
If a value of 0:00 is entered, then the alert will never re-trigger.
Low Alert Trigger Point – If the value of the parameter being monitored falls below the value in this field, the alert will become active.
Trigger Delay – The parameter being monitored must fall below the Low Alert Trigger Point value for longer than the time in this field in order for an alert to become active. This can be used to prevent false alerts caused by parameter values that briefly have a value that would cause an alert but quickly return to the normal value range. The value is entered as minutes : seconds. If only one number is entered, it will be interpreted as seconds.
Low Alert Clear Point – If the alert is active and the parameter value rises above the value in this field, the alert will become inactive.
Clear Delay – The parameter being monitored must rise above the Low Alert Clear Point value for longer than the time in this field in order for the alert to become inactive. The value is entered as minutes : seconds. If only one number is entered, it will be interpreted as seconds.
In this example, the set point may be described in more than one unit, so additional fields have been supplied so that the user can select the units of depth. Changing the units of the set point will also change the units of the clear point. The initial units displayed in these fields will correspond to those set in the Units Dialog (see section 9.4.8.1).
10.4.4.1.4.3 Data Unavailable Alert
The Data Unavailable Alert can be used in conjunction with other alert types when you need to know if a particular parameter is no longer being sent on the network or is flagged as “not available” by the transmitting device. For instance, you probably would want to use a Data Unavailable Alert for the Depth->Current Depth parameter, since it would be advisable to know if the depth sounder were to stop transmitting a depth reading or became unable to determine the depth due to fouling or some other reason. On the other hand, if you were to set a Data Unavailable Alert on Engine->Engine Water Temperature parameter, you would then get an alert every time the ignition was switched off and the engine’s ECU stopped transmitting data.
Trigger Configuration

Figure 128 – Trigger Configuration – Data Unavailable Alert
Accept Re-trigger Period – When you accept an alert, it will change to the “Accepted” state, and annunciators that are sounding for that alert will stop sounding. If the condition which caused the alert remains true after the amount of time in this field, the alert will return to the “Active” state, and annunciators will begin sounding again for that alert.
If a value of 0:00 is entered, then the alert will never re-trigger.
Trigger Delay – If a valid value for the parameter being monitored is continually not received or has an invalid value for the amount of time specified in this field, the alert will become active.
Clear Delay – The parameter being monitored must continually be received with a valid value for longer than the time in this field in order for the alert to become inactive.
10.4.4.1.4.4 On Alert
As opposed to high and low alerts that are associated with analog input signals (i.e., many different possible input values), there are also switch alerts that are associated with a binary input value (sometimes called on or off, yes or no, enabled or disabled, set or reset, active or inactive). The switch alert is similar to the high and low alert except that there are no set or reset points. The mere fact that the switch is seen as On causes the alert to become an active alert (assuming the Set Delay is set to zero). Likewise, if the switch being monitored is seen as false (i.e., binary 0), then the alert becomes inactive (assuming the Clear Delay is set to zero). If the delays are not programmed to zero, then the switch must remain On for the Set Delay before the alert becomes active, and must remain Off for the Clear Delay before the alert becomes inactive. If the switch state reverts to OFF before the Set Delay expires, the alert will not trigger.
Trigger Configuration

Figure 129 – Trigger Configuration – On Alert
Accept Re-trigger Period – When you accept an alert, it will change to the “Accepted” state, and annunciators that are sounding for that alert will stop sounding. If the condition which caused the alert remains true after the amount of time in this field, the alert will return to the “Active” state, and annunciators will begin sounding again for that alert.
If a value of 0:00 is entered, then the alert will never re-trigger.
Trigger Delay – The condition for the parameter being monitored must be in its ON condition for at least the Trigger Delay time before the alert will become active. An interesting use of the Trigger Delay when monitoring a bilge pump (for example) is to set the Set Delay to a large value (say 20 minutes). Now, if the bilge pump runs for more than 20 minutes at a time the alert will be triggered.
Clear Delay – The condition for the parameter being monitored must be not in its ON condition for at least the clear delay time before the alert will become cleared.
10.4.4.1.4.5 Off Alert
As opposed to high and low alerts that are associated with analog input signals (i.e., many different possible input values), there are also switch alerts that are associated with a binary input value (sometimes called on or off, yes or no, enabled or disabled, set or reset, active or inactive). The switch alert is similar to the high and low alert except that there are no set or reset points. The mere fact that the switch is seen as “Off” causes the alert to become an active alert (assuming the Set Delay is set to zero). Likewise, if the switch being monitored is seen as “On”, then the alert becomes inactive (assuming the Clear Delay is set to zero). If the delays are not programmed to zero, then the switch must remain “Off” for the Set Delay before the alert becomes active, and must remain “On” for the Clear Delay before the alert becomes inactive.
Trigger Configuration

Figure 130 – Trigger Configuration – Off Alert
Accept Re-trigger Period – When you accept an alert, it will change to the “Accepted” state, and annunciators that are sounding for that alert will stop sounding. If the condition which caused the alert remains true after the amount of time in this field, the alert will return to the “Active” state, and annunciators will begin sounding again for that alert.
If a value of 0:00 is entered, then the alert will never re-trigger.
Trigger Delay – If the switch being monitored is in the OFF state for the amount of time specified in this field, the alert will become active.
Clear Delay – If the switch being monitored is in a state other than “Off” for the amount of time specified in this field, the alert will become inactive.
10.4.4.1.4.6 Entry On Alert
This is similar to the ON Alert, but once the switch state is seen as ON, the alert will trigger after the Set Delay expires. If the switch reverts to the OFF state during this period, it will not stop the alert from triggering. The only way to stop the alert from triggering is to disable it, typically by changing the Vessel Operating Mode to a mode where the alert is not enabled.
This is designed to be used an entry alert connected to a door switch. e.g. If the Vessel Operating Mode of User 1 is configured as an away mode, and a door switch is monitored as an Entry On Alert in that mode only with a Set Delay of 20 seconds, then after opening a door the user will have 20 seconds to change the Vessel Operating Mode to something other than User 1 (Away) to prevent the Alert from triggering.
Trigger Configuration

Figure 131 – Trigger Configuration – Entry On Alert
Trigger Delay – The condition for the parameter being monitored must be in its ON condition for at least the Trigger Delay time before the alert will become active
Clear Delay – The condition for the parameter being monitored must be not in its ON condition for at least the clear delay time before the alert will become cleared.
10.4.4.1.4.7 Entry Off Alert
This is the same as the Entry On Alert, but will be triggered by the switch going into the OFF state. Most magnetic door switches are closed (ON) when the door is closed, so this would be the appropriate alert to use.
10.4.4.1.4.8 Tripped Alert
When monitoring circuit breakers, the tripped alert can be used to raise an alert when the circuit breaker trips due to over current. As with the On and Off alerts, the Trigger Delay and Clear Delay values are used to prevent spurious triggering.
Trigger Configuration

Figure 132 – Trigger Configuration Editor – Tripped Alert
Accept Re-trigger Period – When you accept an alert, it will change to the “Accepted” state, and annunciators that are sounding for that alert will stop sounding. If the condition which caused the alert remains true after the amount of time in this field, the alert will return to the “Active” state, and annunciators will begin sounding again for that alert.
If a value of 0:00 is entered, then the alert will never re-trigger.
Trigger Delay – If the switch being monitored is in the TRIPPED state for the amount of time specified in this field, the alert will become active.
Clear Delay – If the switch being monitored is in a state other than “Tripped” for the amount of time specified in this field, the alert will become inactive.
10.4.4.1.4.9 Burnt Out Bulb Alert
The Burnt Out Bulb Alert measures the current flowing through a Maretron DCR100 or Carling DC Box only when the switch is ON, and triggers when the current drops below a minimum current.
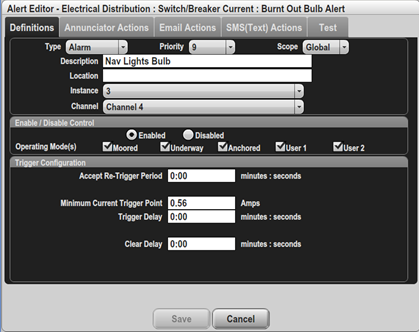
Figure 133 –Configuration – Burnt Out Bulb Alert
Accept Re-trigger Period – When you accept an alert, it will change to the “Accepted” state, and annunciators that are sounding for that alert will stop sounding. If the condition which caused the alert remains true after the amount of time in this field, the alert will return to the “Active” state, and annunciators will begin sounding again for that alert.
If a value of 0:00 is entered, then the alert will never re-trigger.
Minimum Current Trigger Point – The current below which the Alert will trigger. If you have 2 lights, each drawing 0.6A, then both lights will draw 1.2A. Setting the Minimum Current Trigger Point to 0.9A will sound an alarm if only one light is drawing current.
Trigger Delay – The condition for the parameter being monitored must be in its ON condition for at least the Trigger Delay time before the alert will become active. An interesting use of the Trigger Delay when monitoring a bilge pump (for example) is to set the Set Delay to a large value (say 20 minutes). Now, if the bilge pump runs for more than 20 minutes at a time the alert will be triggered.
Clear Delay – The condition for the parameter being monitored must be not in its ON condition for at least the clear delay time before the alert will become cleared.
10.4.4.1.4.10 Low Current When On Alert
This is the same as the Burnt Out Bulb Alert
10.4.4.1.4.11 High Current When On Alert
This is similar to the Burnt Out Bulb Alert, but the Alert will trigger when the measured current is greater than the Maximum Current Trigger Point.
10.4.4.1.4.12 Server Disconnected Alert
The Server Disconnected Alert can be used to raise an alert when the connection to N2KServer is lost due to network problems. As with the On and Off alerts, the Trigger Delay and Clear Delay values are used to prevent spurious triggering.
Note that the Server Disconnected Alert will have some limitation as to the Actions possible when the Alert is triggered. Because the connection to the server has been lost, it will not be possible to display this alert on other N2KView displays, or on DSM250 Displays. It will also not be possible to sound an annunciator. It will be possible to send an email message if the computers Ethernet connection is still available.
Trigger Configuration

Figure 134 – Trigger Configuration Editor – Server Disconnected Alert
Accept Re-trigger Period – When you accept an alert, it will change to the “Accepted” state, and annunciators that are sounding for that alert will stop sounding. If the condition which caused the alert remains true after the amount of time in this field, the alert will return to the “Active” state, and annunciators will begin sounding again for that alert.
If a value of 0:00 is entered, then the alert will never re-trigger.
Trigger Delay – If the Server connection is lost for more than the amount of time specified in this field, the alert will become active.
Clear Delay – After reconnecting, the server connection must be stable for more than the amount of time specified in this field for the alert to clear.
10.4.4.1.4.13 Outside Radius Alert
The Outside Radius Alert is used to signal an alert whenever the vessel moves outside a programmable distance in any direction away from a reference point (expressed as a longitude and latitude). This alert is useful when the vessel is anchored or moored and the vessel should not drift outside a perimeter and if it does, an alert is activated. The point of reference can be selected from the current position or it can be manually entered. The following Figure shows an Outside Radius Alert and associated parameters.
Parameters
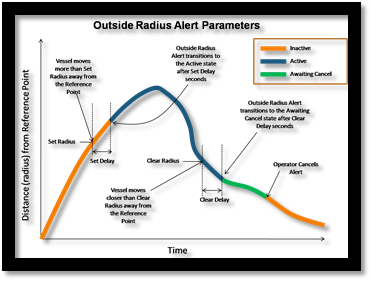
Figure 135 – Outside Radius Alert Parameters
Trigger Configuration – Outside Radius Alert

Figure 136 – Trigger Configuration – Outside Radius Alert
Accept Re-trigger Period – When you accept an alert, it will change to the “Accepted” state, and annunciators that are sounding for that alert will stop sounding. If the condition which caused the alert remains true after the amount of time in this field, the alert will return to the “Active” state, and annunciators will begin sounding again for that alert.
If a value of 0:00 is entered, then the alert will never re-trigger.
Outside Radius Alert Trigger Point – If the distance between the current GPS position and the reference position rises above the value in this field, the alert will become active. The units for the Outside Radius Alert Trigger Point can be set by selecting a value from the drop down list to the right of this field.
Trigger Delay – The distance between the current GPS position and the reference position must rise above the Outside Radius Alert Trigger Point value for longer than the time in this field in order for an alert to become active.
Outside Radius Alert Clear Point – If the alert is active and the distance between the current GPS position and the reference position falls below the value in this field, the alert will become inactive.
Clear Delay – The distance between the current GPS position and the reference position must fall below the Outside Radius Alert Clear value for longer than the time in this field in order for an alert to become inactive.
Latitude – The latitude of the reference position. This may be typed in as <degrees>:<minutes> followed by an N or S. If the N or S is missing, North is assumed. Moving the cursor to another field will reformat the contents of this field.
Longitude – The longitude of the reference position. This may be typed in as <degrees>:<minutes> followed by an E or W. If the E or W is missing, East is assumed. Moving the cursor to another field will reformat the contents of this field.
Get Current Position – Pressing or clicking on this button will transfer the current GPS position into the Latitude and Longitude fields.
10.4.4.1.4.14 Anchor Watch Alert
The Anchor Watch Alert is very similar to the Outside Radius Alert, being tailored to anchoring. It is used to signal an alert whenever the vessel moves a programmable distance in any direction away from an anchor point (expressed as a longitude and latitude). This alert is useful when the vessel is anchored or moored and the vessel should not drift outside a perimeter and if it does, an alert is activated. The point of reference can be selected from the current position or it can be manually entered, or it may be entered by pressing a button on the Anchor Watch Component (see section 9.5.2).
Instancing – Anchor Watch Alert
When editing an Anchor Watch Alert, the instance number of the GPS supplying the vessel’s position must be specified.
Trigger Configuration – Anchor Watch Alert
While the units of the radius for the Outside Radius Alert are expressed in the same units as distance (e.g. Nautical Miles), the units of the Anchor Watch Alert are expressed in the same units as the depth (e.g. feet). This is more convenient because the distance from the anchor will be related to amount of anchor chain released, which in turn is related to the depth at the point of anchor.

Figure 137 – Trigger Configuration – Anchor Watch Alert
Accept Re-trigger Period – When you accept an alert, it will change to the “Accepted” state, and annunciators that are sounding for that alert will stop sounding. If the condition which caused the alert remains true after the amount of time in this field, the alert will return to the “Active” state, and annunciators will begin sounding again for that alert.
If a value of 0:00 is entered, then the alert will never re-trigger.
Anchor Watch Alert Trigger Point– If the distance between the current GPS position and the reference position rises above the value in this field, the alert will become active.
Trigger Delay – The distance between the current GPS position and the reference position must rise above the Outside Radius Alert Trigger Point value for longer than the time in this field in order for an alert to become active.
Anchor Watch Alert Clear Point – If the alert is active and the distance between the current GPS position and the reference position falls below the value in this field, the alert will become inactive.
Clear Delay – The distance between the current GPS position and the reference position must fall below the Anchor Watch Alert Clear value for longer than the time in this field in order for an alert to become inactive.
Latitude – The latitude of the reference position. This may be typed in as <degrees>:<minutes> followed by an N or S. If the N or S is missing, North is assumed. Moving the cursor to another field will reformat the contents of this field. For the Anchor Watch Alert, this field may be left blank if the alert is disabled, enabling the Alert to be created in advance of anchoring.
Longitude – The longitude of the reference position. This may be typed in as <degrees>:<minutes> followed by an E or W. If the E or W is missing, East is assumed. Moving the cursor to another field will reformat the contents of this field. For the Anchor Watch Alert, this field may be left blank if the alert is disabled, enabling the Alert to be created in advance of anchoring.
Get Current Position – Pressing or clicking on this button will transfer the current GPS position into the Latitude and Longitude fields.
10.4.4.1.4.15 Inside Radius Alert
The Inside Radius Alert is similar to the Outside Radius Alert except that an alert is activated if the vessel comes within a certain distance or radius of a reference point (expressed as a longitude and latitude).

Figure 138 – Trigger Configuration – Inside Radius Alert
Accept Re-trigger Period – When you accept an alert, it will change to the “Accepted” state, and annunciators that are sounding for that alert will stop sounding. If the condition which caused the alert remains true after the amount of time in this field, the alert will return to the “Active” state, and annunciators will begin sounding again for that alert.
If a value of 0:00 is entered, then the alert will never re-trigger.
Inside Radius Alert Trigger Point – If the distance between the current GPS position and the reference position falls below above the value in this field, the alert will become active.
Trigger Delay – The distance between the current GPS position and the reference position must fall below the Inside Radius Alert Trigger Point value for longer than the time in this field in order for an alert to become active.
Inside Radius Alert Clear Point – If the alert is active and the distance between the current GPS position and the reference position rises above the value in this field, the alert will become inactive.
Clear Delay – The distance between the current GPS position and the reference position must rise above the Inside Radius Alert Clear value for longer than the time in this field in order for an alert to become inactive.
Latitude – The latitude of the reference position. This may be typed in as <degrees>:<minutes> followed by an N or S. If the N or S is missing, North is assumed. Moving the cursor to another field will reformat the contents of this field.
Longitude – The longitude of the reference position. This may be typed in as <degrees>:<minutes> followed by an E or W. If the E or W is missing, East is assumed. Moving the cursor to another field will reformat the contents of this field.
Get Current Position – Pressing or clicking on this button will transfer the current GPS position into the Latitude and Longitude fields.
10.4.4.1.4.16 GPS Quality Alert
The accuracy, or quality, of a position fix provided by a GPS is dependent on the number of satellites used to compute the position. A position based on less than three satellites is considered a “1D” lock, three satellites is a “2D” lock, more than three satellites is a “3D” lock, and more than three satellites with SBAS is a “3D-DGPS” lock. These different locks are indicative of the quality or accuracy of the given position with 1D having the lowest quality and 3D-DGPS providing the highest quality. The GPS Quality Alert is used to alert you if the quality of the position falls below a specified quality level.
Trigger Configuration – GPS Quality Alert

Figure 139 – Trigger Configuration – GPS Quality Alert
Accept Re-trigger Period – When you accept an alert, it will change to the “Accepted” state, and annunciators that are sounding for that alert will stop sounding. If the condition which caused the alert remains true after the amount of time in this field, the alert will return to the “Active” state, and annunciators will begin sounding again for that alert.
If a value of 0:00 is entered, then the alert will never re-trigger.
GPS Quality Alert Trigger Point, Trigger Delay – When the quality of the GPS fix becomes lower than the quality specified in this field for longer than the time specified in the Trigger Delay field, the alert will become active.
GPS Quality Alert Set Point, Clear Delay – If the alert is active and the quality of the GPS fix becomes higher than the quality specified in the GPS Quality Alert Set Point field for longer than the time specified in the Clear Delay field, the alert will become inactive.
10.4.4.1.4.17 Direction Alert
A Direction Alert is used to indicate that a course, heading or wind direction has changed from the reference direction more than a programmable amount. For example, once a heading has been established, an alert can be generated if the heading changes more than a specified amount. Direction Alerts may also be set for wind direction. The reference direction can be selected from the current direction (heading or wind direction) or it can be manually entered.
Parameters
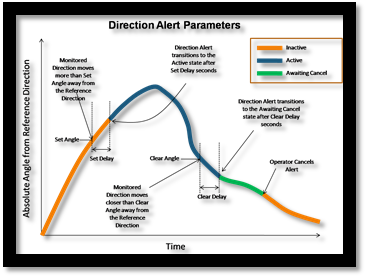
Figure 140 – Direction Alert Parameters
Configuration Example for Course Over Ground

Figure 141 – Trigger Configuration – Direction Alert
Accept Re-trigger Period – When you accept an alert, it will change to the “Accepted” state, and annunciators that are sounding for that alert will stop sounding. If the condition which caused the alert remains true after the amount of time in this field, the alert will return to the “Active” state, and annunciators will begin sounding again for that alert.
If a value of 0:00 is entered, then the alert will never re-trigger.
Offset xxxx Trigger Point, Trigger Delay – If the direction being monitored differs from the reference direction by more than the Offset xxxx Trigger Point for longer than the time specified in the Trigger Delay field, the alert will become active.
xxxx could be Heading, Course Over Ground, or Bearing depending on the value being monitored.
Offset xxxx Clear Point, Clear Delay – If the alert is active and the direction being monitored differs from the reference direction by less than the Offset xxxx Clear Point for longer than the time specified in the Clear Delay field, the alert will become inactive.
Reference Direction – Enter the desired reference direction into this field. If the monitored value differs from this value by more than the Offset Heading Set Point, the alert will be triggered.
Get Current Heading – Pressing or clicking on this button will transfer the current value of the direction being monitored into the Reference Direction Field.
10.4.4.1.4.18 Time Alert
N2KView can be configured with alerts that go active at a predetermined time, such as an alarm clock. These alerts can also be configured to become active periodically, making them useful for signaling watch changes (for example, every four hours) or as a personnel alarm (making sure a crew member is at the helm every 15 minutes).
When a Time Alert with a Repeat Interval of zero is accepted, it will be Disabled to prevent further triggering.
When a Time Alert with a Repeat Interval greater than zero is accepted, it will transition to the Inactive state, waiting for the next time it should trigger.
Trigger Configuration – Time Alert

Figure 142 – Alert Editor – Time Alert
Repeat Interval – The alert will become active again after the period specified in this field. For example, if the Alarm Time were set to 8:00 and the Repeat Interval were set to 1:00 (1 hour, zero minutes), the Alarm would become active again at 9:00, 10:00, and so on. The field will reformat when the cursor is moved to a different field.
If a value of 0:00 is entered, then the alert will not repeat.
Time Alert Trigger Point – The alert will become active at the time specified in this field. If the time specified has already passed, then the alarm will be set for the next day. One of the following options may be selected:
· Time: The time may be specified directly by setting the Alarm Time and Time Zone. The repeat interval may be set to determine how frequently the alarm recurs. The Time may be specified in Local, UTC, or any time zone
· Sunrise: The alert will trigger at Sunrise every day
· Sunrise: The alert will trigger at Sunset every day
· Twilight AM: The alert will trigger at Nautical Twilight every morning
· Twilight PM: The alert will trigger at Nautical Twilight every evening
· Immediate: The alert will start timing the Repeat Interval immediately on becoming Active. E.g. if set Active only in the Underway mode, and set to 2 hours, it can be used to set the times to change watches every two hours, starting when the vessel mode is set to Underway.
Alarm Time – This field is visible when the Time Alert Trigger Point is Time. Entering a number without the colon will assume that the hours are zero. The field will reformat when the cursor is moved to a different field.
Time Zone – This field is visible when the Time Alert Trigger Point is Time. The Time Zone in which the alert time is compared to the current time. The time zone is chosen from a drop down list. The list includes a value of “Local” which means that an alarm set for 7:00 will be triggered at 7:00 am local time even when the time zones change.
Time Alert Clear Point – Time Alerts may be accepted automatically according to one of the following options
· Time. The time may be specified directly by setting the Time Alert Clear Point
· Sunrise: The alert will be accepted at Sunrise every day
· Sunrise: The alert will be accepted at Sunset every day
· Twilight AM: The alert will be accepted at Nautical Twilight every morning
· Twilight PM: The alert will be accepted at Nautical Twilight every evening
· Fixed Delay: The alert will be accepted after a fixed delay
· None: The alert will never be accepted automatically.
10.4.4.2 Condition Tab
The parameters in the Condition Tab are similar to those in the Definition tab, and are used to select the condition that must be met for the data entered in the Definition tab to be evaluated.
When first opened, the Condition tab looks like this.
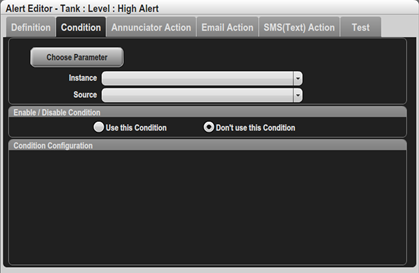
The Condition is disabled, and there is no parameter associated with the condition.
To change the Alert to a Conditional Alert, we add a Condition by choosing the parameter on which the condition will be met. Pressing the Choose Parameter button will show a list of conditions in the familiar tree format.
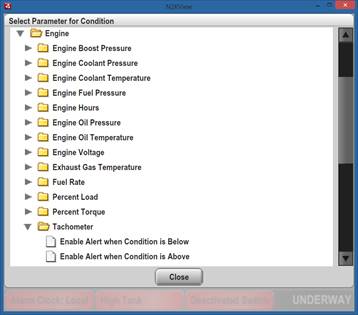
Here the Engine category has been expanded, and then the Tachometer parameter. There are two choices here – either Enable the Alert when the Tachometer is below a certain value or Enable the Alert when the Tachometer is above a certain value. Choosing one of these conditions returns to the Alert Editor, enabling the condition and populating the tab.
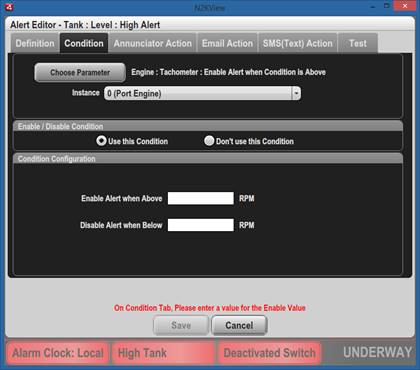
Now the details for the Condition can be entered by choosing the Instance, Source (if applicable), Channel (if applicable) and the values when the condition is met and cleared
10.4.4.3 Annunciator Actions Tab
An Annunciator (such as Maretron’s ALM100) connects to the NMEA 2000 bus and will sound an alarm on command. Channels on the DCR100 may also be programmed to sound alarms. The type of alarm is transmitted to the annunciator from N2KView.
The Annunciator Actions tab for the Alert Actions Dialog is shown below.
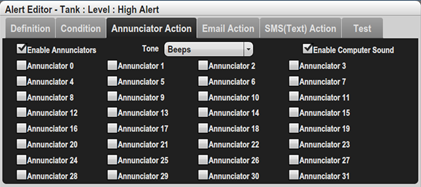
Figure 143 – Alert Editor– Annunciator Actions
Enable Annunciators – This is a single check box that can be used to disable all the annunciators for this Alert.
Enable Computer Sound – This check box can be used to disable this computer’s sound for this Alert. It does not disable the sounds generated by remote N2KView stations or DSM250s in response to this Alert.
Tone – N2KView supports the presence of up to 32 different annunciators on the vessel. All annunciators must sound with the same tone, which is selected from a drop-down list.
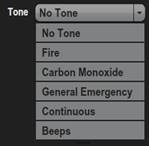
Figure 144 – Annunciator Tone Selection
Annunciators – For each alert, you may choose which annunciators sound the selected tone. For example, you may wish the annunciator in the owner’s stateroom to sound in the event of a general emergency or if smoke is detected, but not if the engine coolant temperature is too high. If the annunciator has been programmed with a label, N2KView will get the label from the annunciator and append the label to the instance number. This makes it easier to know which annunciator is being referenced.
10.4.4.4 Email Actions Tab
On triggering or clearing, alerts may be programmed to send emails to one or more email addresses. Before configuring the email actions for an alert, the following must be set up:
· N2KView system must be set up to transmit alerts (see section 0)
· A default email address and/or an address book of recipients must be set up in N2KView (see sections 10.4.6.1.6 and 10.4.6.1.8)
· You must have an Email account with your internet provider.
· You must have an Ethernet connection that enables access to your Internet Provider
The Email Actions Tab for the Alert Editor is shown below.
Figure 145 – Alert Actions Dialog – Email Actions Tab
The title of the message is pre-defined and will contain the description and location of the alarm as well as a description of the type of event.
N2KView can send an e-mail notice when an alert becomes active or inactive. N2KView creates a list of recipient email addresses by concatenating the addresses in the Use Default Address field with the list of addresses in the Use Additional Address(es) field for each Alert. Either field may be blank. This combination allows an efficient way of entering common email addresses while providing the flexibility of having each alert directed to specific users.
Most cell phone service providers allow short emails to be sent to cell phones as Text Messages. Contact your cell phone provider to obtain the email address of your cell phone.
Enable Email Transmission when Alert is Triggered – This check box can be used to enable or disable the transmission of Email messages for this Alert when the Alert moves into the Active State. When the box is checked the emails will be sent.
Enable Email Transmission when Alert is Cleared – This check box can be used to enable or disable the transmission of Email messages for this Alert when the Alert moves into the Inactive or Awaiting Cancel States. When the box is checked the emails will be sent.
Operating Modes – The email will only be transmitted when the vessel is in one of the selected Vessel Operating Modes.
Use Default Address – When this box is checked, the Default Email Address from the Email Setup dialog (see 10.4.6.1.6) will be added to the list of addresses for this alert. If no default address has been established, then this field will be disabled. The default address will be displayed next to the check box, and may not be edited from here.
![]()
If there is no default address specified in the Email Setup dialog, the checkbox is greyed out, and a message is displayed.
![]()
Use Additional Address(es) – If this check box is ticked, then you will be able to select extra recipients for the email from the Email Address book (see 10.4.6.1.5). The recipients are selected from a drop down list.

After selection the list of addresses is displayed next to the check box.
![]()
Message when Alert is Triggered – this text is transmitted when the condition causing the alert becomes true. If this field is blank, the message will still be transmitted, but without user entered details.
Message when Alert is Cleared – this text is transmitted when the condition causing the alert becomes false (when the alert transitions from Active to Awaiting Cancel or is disabled). If this field is blank, the message will still be transmitted, but without user entered details.
Embedded Parameter Help – Parameters may be embedded into the Email. When the email is composed, these parameters are evaluated and the current value placed in the message. E.g. to transmit the current depth in the message place the string {$DEPTH} in the message. It will be translated to a numeric value. The Embedded Parameter Help button will display the list of strings that can be translated.
10.4.4.4.1 Conditions for Sending an Email
For the transmission of an email to be attempted, the following conditions must be met.
· The Outgoing SMTP Server Name in the Email Setup Dialog must be filled in (10.4.6.1.1).
· The Mail Account User Name in the Email Setup Dialog must be filled in (10.4.6.1.3).
· The Enable Email Transmission when Alert is Triggered box for the Alert must be checked and the Alert has just gone into the Active state.
· The Enable Email Transmission when Alert is Cleared box for the Alert must be checked and the Alert has just gone into the Awaiting Cancel state or Inactive state (i.e. the alert condition has cleared)
· An Email Address to which the email will be sent must be filled in. This can either be a specific email Address for the Alert (see above) or the Default Email Address in the Connections Setting Dialog (10.4.6.1.6) – in which case the Add Default Address box in the Alert Email Edit must be checked (see above).
10.4.4.4.2 Email Message Format
A typical email message is shown below.
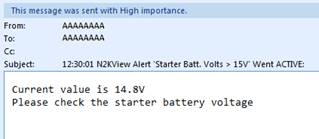
(Note: Some Email Servers do not recognize the subject and will place it as part of the body of the email)
The subject of the Alert Email consists of the following information
· Time at which the alert become active or inactive.
· The word “N2KView”.
· The word “Test” if the alert was generated as a result of the Save and Test button being pressed.
· The word “Alert”
· The description of the Alert as entered by the user.
· What happened ( e.g. the alert “went Active”)
The body of the Alert Email contains:
· The current value of the parameter that triggered the alert
· The activated or deactivated message that was entered by the operator with embedded parameters translated to numeric values.
10.4.4.5 SMS (Text) Actions Tab
The SMS (Text) Actions Tab for the Alert Editor is shown below.
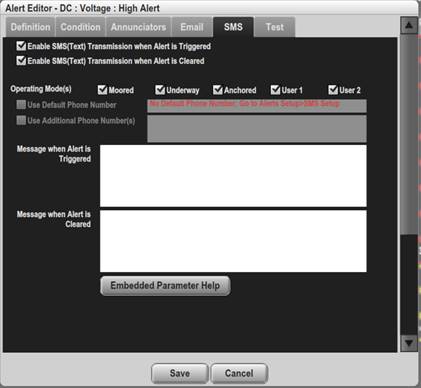
Figure 146 – Alert Editor– SMS (Text) Actions Tab
Please note that an SMS100 with a valid cellular connection must be available on the NMEA2000® bus for SMS (Text) messages to be transmitted. The title of the message is pre-defined and will contain the description and location of the alarm as well as a description of the type of event.
N2KView can send an Short Message (SMS or Text message) when an alert becomes active or inactive. N2KView creates a list of recipient phone numbers by concatenating the numbers in the Use Default Phone Number field with the list of numbers in the Use Additional Phone Number(s) field for each Alert. Either field may be blank. This combination allows an efficient way of entering common phone numbers while providing the flexibility of having each alert directed to specific users.
Enable SMS (Text) Transmission when Alert is Triggered – This check box can be used to enable or disable the transmission of messages for this Alert when the Alert moves into the Active State. When the box is checked the messages will be sent.
Enable SMS (Text) Transmission when Alert is Cleared – This check box can be used to enable or disable the transmission of messages for this Alert when the Alert moves into the Inactive or Awaiting Cancel States. When the box is checked the messages will be sent.
Operating Modes – The SMS will only be transmitted when the vessel is in one of the selected Vessel Operating Modes.
Use Default Phone Number– When this box is checked, the Default SMS Phone Number from the Connections tab (see 10.4.7.1.4) will be added to the list of addresses for this alert. If no default phone number has been established, then this field will be disabled. The default phone number will be displayed next to the check box, and may not be edited from here.
![]()
If the Default Phone Number has not been set in the SMS Setup Dialog (see 10.4.7.1.4) then the check box is greyed out and a message displayed.
![]()
Use Additional Phone Number (s) – If this check box is ticked, then you will be able to select extra recipients for the Text Message from the SMS Phone book (see 10.4.7.1.6). The recipients are selected from a drop down list.

After selection the list of phone numbers with names is displayed next to the check box.
![]()
Message when Alert is Triggered – this text is transmitted when the condition causing the alert becomes true. If this field is blank, the message will still be transmitted, but without user entered details.
Message when Alert is Cleared – this text is transmitted when the condition causing the alert becomes false (when the alert transitions from Active to Awaiting Cancel or is disabled). If this field is blank, the message will still be transmitted, but without user entered details.
Embedded Parameter Help – Parameters may be embedded into the SMS. When the Text Message is composed, these parameters are evaluated and the current value placed in the message. E.g. to transmit the current depth in the message place the string {$DEPTH} in the message. It will be translated to a numeric value. The Embedded Parameter Help button will display the list of strings that can be translated.
10.4.4.6 Switches Tab
An alert may be used to control switches. If the function that you are trying to control is critical, then this is not the way to achieve that function. Critical functions should be contained in a small self-contained control unit and then monitored by N2KView to ensure that they are operating correctly. The Switches tab is shown below:
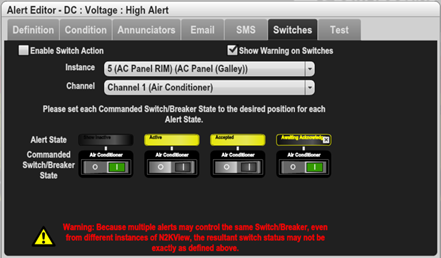
Figure 147 – Alert Editor– Switch Actions Tab
Enable Switch Action – this must be checked for the action to be performed.
Show Warning on Switches – when this box is checked, the switch controlled by the alert will be decorated to show that it may be controlled by an Alert.

Instance – a dropdown list that is used to select the Instance No of the switch that is being controlled.
Channel – a dropdown list that is used to select the Channel No of the switch that is being controlled.
Alert State – these are headings for the four switches below them.
Commanded Switch/Breaker State – These four switches are used to select which breaker state ( OFF | ON ). Commands will be sent to the switch only on a state change. No attempt is made to ensure that the switch state is maintained after that. e.g. in the above example, when the alert transitions into the Active State, switch 5-1 will be commanded OFF. When the alert transitions from the Active State into the Accepted State, the switch will be commanded to OFF again, and when it transitions into the Inactive or Awaiting Acknowledgement State, it will be commanded to ON.
10.4.4.7 Test Tab
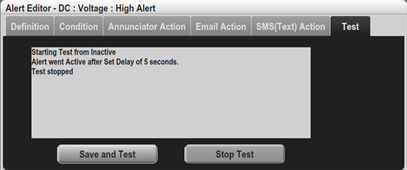
Pressing the Save and Test Button will first save the alert in the database, and then issue a command to simulate the transition of the monitored value to a value that would activate the alert, giving a full test of all the actions associated with the Alert. The word “Test” will be pre-pended to all descriptions of the alert, including Text Message titles. Note that pressing the Test button will simulate the value applied to the alert going out of range, so the full range of alert functionality will be tested. Because of this, the alert will only become active after the Set Delay has expired.
The Stop Test button can be used to stop the test. The alert will transition to the Inactive state after the Clear Delay has expired.
A Log of the activity of the Alert is displayed to show the user what actions the Alert is performing.
10.4.5 Operating Mode
Pressing the Operating Mode button will open the Operating Mode dialog.
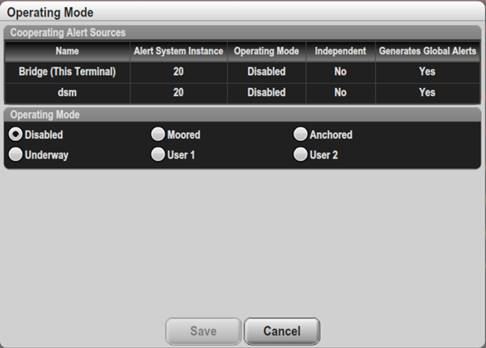
Note that in the General Configuration dialog (9.4.6.1.7) there is an option “Allow Operating Mode Change without Password Protection”. If this box is checked and a password has been entered in the Password dialog (9.4.10.1), then the Operating Mode dialog may be entered without using the password. This allows users to change the vessel operating mode and choose which terminal(s) will generate Global Alerts without being able to change the rest of the configuration.
Clicking on the Vessel Mode in the Alerts Status Bar will also cause the Operating Mode Dialog to appear.
10.4.5.1 Cooperating Alert Sources
The interaction between different copies of N2KView managing alerts can be quite complex. If the same configuration is loaded on more than one terminal, each of these terminals will detect the same alert condition and generate an alert. This will result in multiple alerts being displayed on all the terminals for the same event. To prevent this, a couple of methods may be adopted. The Cooperating Alert Sources table summarizes the interaction between different copies of N2KView, with each line in the table corresponding to one copy of N2KView found on the network.
Name – The name of the terminal as entered in the General Configuration Dialog
Alert System Instance – N2KView has different instance numbers than the hardware it runs on, or connects to. The first step in getting multiple displays to cooperate with regards to Alerts is to make the N2KView instances unique. In the above example, both the dsm and Bridge Alert Sources have the same Alert System Instance, which is incorrect. The Alert System Instance is derived from the Device Instance Number of the IPG100, USB100, TSM810C, or MBB300C. For the system to operate correctly these Device Instance Numbers must be unique and less than 7.
Operating Mode – each instance of N2KView will report its Vessel Operating Mode. These should all be the same, unless the instance is operating in the Independent Mode.
Independent – will be set to Yes if the instance is operating in Independent Mode, otherwise it will be No. Independent Mode is set by checking the Don’t Change this terminal operating mode when a remote terminal operating mode is changed box in the Alert Options dialog. (see section 10.4.1).
Generates Global Alerts – will be set to Yes if the instance is set to generate Global Alerts(see section 0).
Local Alerts are not affected. Because they are not shared they will never result in duplicate alerts on one terminal.
10.4.5.2 Operating Mode
In this dialog, you may select the vessel’s operating mode from one of the following choices:
· Disabled – This selection disables all alerts on the vessel. No alerts will be generated for any reason.
· Moored – This selection sets the vessel’s operating mode to “Moored”. All alerts which are enabled in “Moored” mode will be enabled. All other alerts will be disabled.
· Anchored – This selection sets the vessel’s operating mode to “Anchored”. All alerts which are enabled in “Anchored” mode will be enabled. All other alerts will be disabled.
· Underway – This selection sets the vessel’s operating mode to “Underway”. All alerts which are enabled in “Underway” mode will be enabled. All other alerts will be disabled.
· User 1– This selection sets the vessel’s operating mode to “User 1”. All alerts which are enabled in “User 1” mode will be enabled. All other alerts will be disabled.
· User 2– This selection sets the vessel’s operating mode to “User 2”. All alerts which are enabled in “User 2” mode will be enabled. All other alerts will be disabled.
Changing the Operating Mode may disable a number of alerts. If any alerts are Active or Awaiting Cancel they will remain Active or Awaiting Cancel until acknowledged by the user, when they will be disabled if they are disabled in the new operating mode. Alerts that have been Accepted (i.e. the condition causing the alert is still present) will be disabled immediately if they are disabled in the new operating mode.
10.4.6 Email Setup
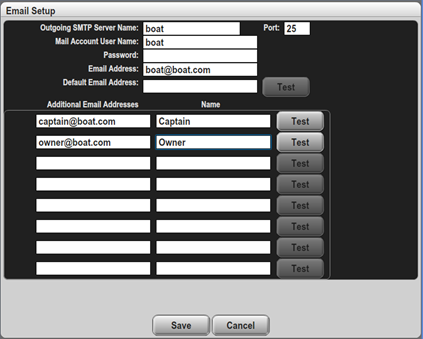
The fields in this section are used to configure the connection to your email server. The Alerts Feature of N2KView has the ability to send emails to a list of users when an alert is detected or cleared. This capability is dependent on N2KView being able to establish a connection to an email server. The email service is not provided by Maretron; and can be the same Email service that you have for standard email. If you are using Outlook as your email program, all these settings can be found in the Tools à Account Settings à Email dialog.
From version 3.5.0, N2KView is capable of sending mail to secure TLS/SSL servers and plain text Email servers.
10.4.6.1.1 Outgoing SMTP Server Name
This is the name of your mail server.
10.4.6.1.2 Port
This is the port number through which the email connection is established. Normally Port 25 is correct for Plain and 465 for SSL/TLS.
10.4.6.1.3 Mail Account User Name
This is your username on the mail server.
10.4.6.1.4 Password
This is the password required to access your account on the mail server.
10.4.6.1.5 Email Address
This is the email address that will appear in the “from” area of the emails sent by N2KView. While this address does not have to be filled in for emails to be sent, it is advised to put an address in here so that you recognize the email sender when you receive it. Also some email spam programs may mark emails without a sender as spam.
10.4.6.1.6 Default Email Address
To make configuration easier, it is possible to send all emails to a common address. If this address changes, then the change only needs to be made in one place.
10.4.6.1.7 Test
The Test button is used to establish that the Email connection is working, without having to generate an Alert. Press the button and an email will be sent to the address specified in the Default Email Address field.
A detailed log of the email activity will also be stored by N2KView and may be viewed by pressing F12 from the main screen. Typical contents should be similar to this. If you are having a problem with sending a test email, make a copy of this portion from the log and ask your email service provider for assistance.
Mon Mar 7 08:56:21 GMT-0700 2011: ================================================================
Mon Mar 7 08:56:21 GMT-0700 2011: === Sending email with subject 'N2KView Test Email' to [email protected]
Mon Mar 7 08:56:21 GMT-0700 2011: === 'This is a test email from N2KView.'
Mon Mar 7 08:56:21 GMT-0700 2011: ================================================================
Mon Mar 7 08:56:21 GMT-0700 2011: SMTPMailer connect to MARETRON-EMAIL-SERVER port 25
Mon Mar 7 08:56:21 GMT-0700 2011: SMTPMailer received message
Mon Mar 7 08:56:21 GMT-0700 2011: <-- 220 maretron-email-server.maretron.com Microsoft ESMTP MAIL Service, Version: 6.0.3790.3959 ready at Mon, 7 Mar 2011 08:56:25 -0700
Mon Mar 7 08:56:21 GMT-0700 2011: SMTPMailer.sendAuthMail
Mon Mar 7 08:56:21 GMT-0700 2011: --> EHLO MARETRON-EXCH
Mon Mar 7 08:56:21 GMT-0700 2011: SMTPMailer received message
Mon Mar 7 08:56:21 GMT-0700 2011: <-- 250-maretron-email-server.maretron.com Hello [192.168.0.72]
<-- 250-TURN
<-- 250-SIZE
<-- 250-ETRN
<-- 250-PIPELINING
<-- 250-DSN
<-- 250-ENHANCEDSTATUSCODES
<-- 250-8bitmime
<-- 250-BINARYMIME
<-- 250-CHUNKING
<-- 250-VRFY
<-- 250-TLS
<-- 250-STARTTLS
<-- 250-X-EXPS GSSAPI NTLM LOGIN
<-- 250-X-EXPS=LOGIN
<-- 250-AUTH GSSAPI NTLM LOGIN
<-- 250-AUTH=LOGIN
<-- 250-X-LINK2STATE
<-- 250-XEXCH50
<-- 250 OK
Mon Mar 7 08:56:21 GMT-0700 2011: SMTPMailer authenticate
Mon Mar 7 08:56:21 GMT-0700 2011: --> AUTH LOGIN
Mon Mar 7 08:56:21 GMT-0700 2011: SMTPMailer received message
Mon Mar 7 08:56:21 GMT-0700 2011: <-- 334 VXNlcm5hbWU6
Mon Mar 7 08:56:21 GMT-0700 2011: decodedResponse = username:
Mon Mar 7 08:56:21 GMT-0700 2011: sending username AAAAAAAAA
Mon Mar 7 08:56:21 GMT-0700 2011: SMTPMailer received message
Mon Mar 7 08:56:21 GMT-0700 2011: <-- 334 UGFzc3dvcmQ6
Mon Mar 7 08:56:21 GMT-0700 2011: decodedResponse = password:
Mon Mar 7 08:56:21 GMT-0700 2011: sending password xxxx
Mon Mar 7 08:56:21 GMT-0700 2011: SMTPMailer received message
Mon Mar 7 08:56:21 GMT-0700 2011: <-- 235 2.7.0 Authentication successful.
Mon Mar 7 08:56:21 GMT-0700 2011: SMTPMailer sending mail header
Mon Mar 7 08:56:21 GMT-0700 2011: --> MAIL FROM:<[email protected]>
Mon Mar 7 08:56:21 GMT-0700 2011: --> RCPT TO:<[email protected]>
Mon Mar 7 08:56:21 GMT-0700 2011: --> DATA
Mon Mar 7 08:56:21 GMT-0700 2011: SMTPMailer received message
Mon Mar 7 08:56:21 GMT-0700 2011: <-- 250 2.1.0 [email protected] OK
Mon Mar 7 08:56:21 GMT-0700 2011: SMTPMailer received message
Mon Mar 7 08:56:21 GMT-0700 2011: <-- 250 2.1.5 [email protected]
<-- 354 Start mail input; end with <CRLF>.<CRLF>
Mon Mar 7 08:56:21 GMT-0700 2011: SMTPMailer sending data
Mon Mar 7 08:56:21 GMT-0700 2011: --> Date:07 Mar 2011 08:56:21 -0700
From:[email protected]
Subject:N2KView Test Email
This is a test email from N2KView.
.
Mon Mar 7 08:56:22 GMT-0700 2011: SMTPMailer received message
Mon Mar 7 08:56:22 GMT-0700 2011: <-- 250 2.6.0 <[email protected]> Queued mail for delivery
Mon Mar 7 08:56:22 GMT-0700 2011: mail was sent OK
Mon Mar 7 08:56:22 GMT-0700 2011: SMTPMailer closed
10.4.6.1.8 Email Address Book
The Email Address Book contains up to 8 additional email addresses, identified by a name of your choosing, and a test button. These entries may be selected within each alert as a destination for emails.
10.4.7 SMS (Text) Setup
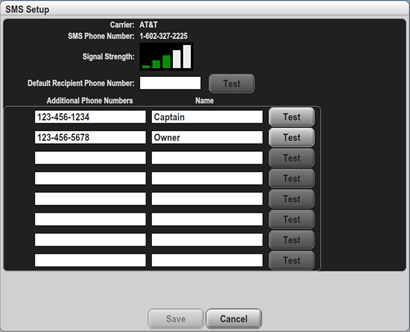
The fields in this section are used to configure the phone number to which Text messages may be sent. In addition, the status of the SMS100 is displayed. The Alerts Feature of N2KView has the ability to send SMS (Text Messages) to a list of users when an alert is detected or cleared. This capability is dependent on N2KView being able to establish a connection to cellular network.
10.4.7.1.1 Carrier
This is the name of your mobile Carrier, displayed only when an SMS100 has been detected on the NMEA2000 bus.
10.4.7.1.2 SMS Phone Number
This is the phone number of the SMS card installed in the SMS100.
10.4.7.1.3 Signal Strength
This is the strength of the mobile phone signal, as reported by the SMS100.
10.4.7.1.4 Default Phone Number
To make configuration easier, it is possible to send all Text Messages to a common phone number. If this number, then the change only needs to be made in one place.
10.4.7.1.5 Test
The Test button is used to establish that the SMS connection is working, without having to generate an Alert. Press the button and an SMS (Text) will be sent to the phone number specified in the Default Phone number field.
10.4.7.1.6 Phone Book
The SMS (Text) Phone Book contains up to 8 additional phone numbers, identified by a name of your choosing, and a test button. These entries may be selected within each alert as a destination for Text Messages.
10.4.7.1.7 Auto-Response Messages
From version 6.0.10, N2KView will examine the messages received by the SMS100, and will automatically generate a response if the contents of the received text message match one of the Keys in the auto-response table. The match is case sensitive.
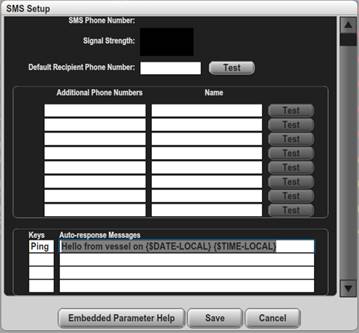
In the above example, if the message “Ping” is received by N2KView then N2KView would respond with the message “Hello from vessel on 2019-04-23 09:34:23”
Pressing Embedded Parameter Help will display a list of parameter that may be embedded into the response message.
10.4.8 Alerts for each Parameter
The N2KView system organizes the various available data types into a two-level system of data Categories and data Types. Each data category consists of a number of closely-related data types. This section enumerates all of the data types for which alerts are available and lists the available alerts for each.
10.4.9 AC Bus
10.4.9.1 Average Frequency
Monitors the average frequency of an AC bus across all phases.
Alert Types: Low Alert, High Alert, Data Unavailable Alert
Units: Hertz
Instances: 253
10.4.9.2 Average Line-Line Voltage
Monitors the average line to line RMS voltage of an AC bus across all phases.
Alert Types: Low Alert, High Alert, Data Unavailable Alert
Units: Hertz
Instances: 253
Alert Types: Low Alert, High Alert, Data Unavailable Alert
10.4.9.3 Average Line-Neutral Voltage
Monitors the average line to neutral RMS voltage of an AC bus across all phases.
Alert Types: Low Alert, High Alert, Data Unavailable Alert
Units: Hertz
Instances: 253
10.4.9.4 Phase A Frequency
Monitors the frequency of phase A of an AC bus.
Alert Types: Low Alert, High Alert, Data Unavailable Alert
Units: Hertz
Instances: 253
10.4.9.5 Phase A Line-Neutral Voltage
Monitors the voltage between Phase A and Neutral of an AC bus.
Alert Types: Low Alert, High Alert, Data Unavailable Alert
Units: Hertz
Instances: 253
10.4.9.6 Phase AB Line-Line Voltage
Monitors the voltage between Phase A and Phase B of an AC bus.
Alert Types: Low Alert, High Alert, Data Unavailable Alert
Units: Hertz
Instances: 253
Alert Types: Low Alert, High Alert, Data Unavailable Alert
10.4.9.7 Phase B Frequency
Monitors the frequency of phase B of an AC bus.
Alert Types: Low Alert, High Alert, Data Unavailable Alert
Units: Hertz
Instances: 253
10.4.9.8 Phase B Line-Neutral Voltage
Monitors the voltage between Phase B and Neutral of an AC bus.
Alert Types: Low Alert, High Alert, Data Unavailable Alert
Units: Hertz
Instances: 253
10.4.9.9 Phase BC Line-Line Voltage
Monitors the voltage between Phase B and Phase C of an AC bus.
Alert Types: Low Alert, High Alert, Data Unavailable Alert
Units: Hertz
Instances: 253
Alert Types: Low Alert, High Alert, Data Unavailable Alert
10.4.9.10 Phase C Frequency
Monitors the frequency of phase C of an AC bus.
Alert Types: Low Alert, High Alert, Data Unavailable Alert
Units: Hertz
Instances: 253
10.4.9.11 Phase C Line-Neutral Voltage
Monitors the voltage between Phase C and Neutral of an AC bus.
Alert Types: Low Alert, High Alert, Data Unavailable Alert
Units: Hertz
Instances: 253
10.4.9.12 Phase CA Line-Line Voltage
Monitors the voltage between Phase C and Phase A of an AC bus.
Alert Types: Low Alert, High Alert, Data Unavailable Alert
Units: Hertz
Instances: 253
Alert Types: Low Alert, High Alert, Data Unavailable Alert
10.4.10 AC Generator
10.4.10.1 Average Current
Monitors the average AC RMS current from a generator across all phases.
Alert Types: Low Alert, High Alert, Data Unavailable Alert
Instances: 253
10.4.10.2 Average Frequency
Monitors the average frequency of the AC power from a generator across all phases.
Alert Types: Low Alert, High Alert, Data Unavailable Alert
Instances: 253
10.4.10.3 Average Line-Line Voltage
Monitors the average line to line RMS voltage of the AC power from a generator across all phases.
Alert Types: Low Alert, High Alert, Data Unavailable Alert
Instances: 253
10.4.10.4 Average Line-Neutral Voltage
Monitors the average line to neutral RMS voltage of the AC power from a generator.
Alert Types: Low Alert, High Alert, Data Unavailable Alert
Instances: 253
10.4.10.5 Phase A Apparent Power
Monitors the Apparent Power being sourced from a generator on phase A.
Alert Types: Low Alert, High Alert, Data Unavailable Alert
Instances: 253
10.4.10.6 Phase A Current
Monitors the AC RMS electrical current being sourced from a generator on phase A.
Alert Types: Low Alert, High Alert, Data Unavailable Alert
Instances: 253
10.4.10.7 Phase A Frequency
Monitors the frequency of phase A of a generator.
Alert Types: Low Alert, High Alert, Data Unavailable Alert
Instances: 253
10.4.10.8 Phase A Line-Neutral Voltage
Monitors the RMS voltage between Phase A and neutral of a generator.
Alert Types: Low Alert, High Alert, Data Unavailable Alert
Instances: 253
10.4.10.9 Phase A Power Factor
Monitors the Power Factor of Phase A of a generator.
Alert Types: Low Alert, High Alert, Data Unavailable Alert
Instances: 253
10.4.10.10 Phase A Reactive Power
Monitors the Reactive Power on Phase A of a generator.
Alert Types: Low Alert, High Alert, Data Unavailable Alert
Instances: 253
10.4.10.11 Phase A Real Power
Monitors the Real Power on Phase A of a generator.
Alert Types: Low Alert, High Alert, Data Unavailable Alert
Instances: 253
10.4.10.12 Phase AB Line-Line Voltage
Monitors the RMS voltage between Phase A and Phase B of a generator.
Alert Types: Low Alert, High Alert, Data Unavailable Alert
Instances: 253
10.4.10.13 Phase B Apparent Power
Monitors the Apparent Power being sourced from a generator on phase B.
Alert Types: Low Alert, High Alert, Data Unavailable Alert
Instances: 253
10.4.10.14 Phase B Current
Monitors the AC RMS electrical current being sourced from a generator on phase B.
Alert Types: Low Alert, High Alert, Data Unavailable Alert
Instances: 253
10.4.10.15 Phase B Frequency
Monitors the frequency of phase B of a generator.
Alert Types: Low Alert, High Alert, Data Unavailable Alert
Instances: 253
10.4.10.16 Phase B Line-Neutral Voltage
Monitors the RMS voltage between Phase B and neutral of a generator.
Alert Types: Low Alert, High Alert, Data Unavailable Alert
Instances: 253
10.4.10.17 Phase B Power Factor
Monitors the Power Factor of Phase B of a generator.
Alert Types: Low Alert, High Alert, Data Unavailable Alert
Instances: 253
10.4.10.18 Phase B Reactive Power
Monitors the Reactive Power on Phase B of a generator.
Alert Types: Low Alert, High Alert, Data Unavailable Alert
Instances: 253
10.4.10.19 Phase B Real Power
Monitors the Real Power on Phase B of a generator.
Alert Types: Low Alert, High Alert, Data Unavailable Alert
Instances: 253
10.4.10.20 Phase BC Line-Line Voltage
Monitors the RMS voltage between Phase B and Phase C of a generator.
Alert Types: Low Alert, High Alert, Data Unavailable Alert
Instances: 253
10.4.10.21 Phase C Apparent Power
Monitors the Apparent Power being sourced from a generator on phase C.
Alert Types: Low Alert, High Alert, Data Unavailable Alert
Instances: 253
10.4.10.22 Phase C Current
Monitors the AC RMS electrical current being sourced from a generator on phase C.
Alert Types: Low Alert, High Alert, Data Unavailable Alert
Instances: 253
10.4.10.23 Phase C Frequency
Monitors the frequency of phase C of a generator.
Alert Types: Low Alert, High Alert, Data Unavailable Alert
Instances: 253
10.4.10.24 Phase C Line-Neutral Voltage
Monitors the RMS voltage between Phase C and neutral of a generator.
Alert Types: Low Alert, High Alert, Data Unavailable Alert
Instances: 253
10.4.10.25 Phase C Power Factor
Monitors the Power Factor of Phase C of a generator.
Alert Types: Low Alert, High Alert, Data Unavailable Alert
Instances: 253
10.4.10.26 Phase C Reactive Power
Monitors the Reactive Power on Phase C of a generator.
Alert Types: Low Alert, High Alert, Data Unavailable Alert
Instances: 253
10.4.10.27 Phase C Real Power
Monitors the Real Power on Phase C of a generator.
Alert Types: Low Alert, High Alert, Data Unavailable Alert
Instances: 253
10.4.10.28 Phase CA Line-Line Voltage
Monitors the RMS voltage between Phase C and Phase A of a generator.
Alert Types: Low Alert, High Alert, Data Unavailable Alert
Instances: 253
10.4.10.29 Total Apparent Power
Monitors the Total Apparent Power being sourced from a generator on all phases.
Alert Types: Low Alert, High Alert, Data Unavailable Alert
Instances: 253
10.4.10.30 Total Power Factor
Monitors the Total Power Factor of a generator across all phases.
Alert Types: Low Alert, High Alert, Data Unavailable Alert
Instances: 253
10.4.10.31 Total Reactive Power
Monitors the Total Reactive Power on all phases of a generator.
Alert Types: Low Alert, High Alert, Data Unavailable Alert
Instances: 253
10.4.10.32 Total Real Power
Monitors the Total Real Power on all phases of a generator.
Alert Types: Low Alert, High Alert, Data Unavailable Alert
Instances: 253
10.4.10.33 Total kWh Export
Monitors the Total kilowatt-hours exported from a generator.
Alert Types: Low Alert, High Alert, Data Unavailable Alert
Instances: 253
10.4.10.34 Total kWh Import
Monitors the Total kilowatt-hours imported to a generator.
Alert Types: Low Alert, High Alert, Data Unavailable Alert
Instances: 253
10.4.11 AC Utility
10.4.11.1 Average Current
Monitors the average AC RMS current from a utility across all phases.
Alert Types: Low Alert, High Alert, Data Unavailable Alert
Instances: 253
10.4.11.2 Average Frequency
Monitors the average frequency of the AC power from a Utility across all phases.
Alert Types: Low Alert, High Alert, Data Unavailable Alert
Instances: 253
10.4.11.3 Average Line-Line Voltage
Monitors the average line to line RMS voltage of the AC power from a Utility across all phases.
Alert Types: Low Alert, High Alert, Data Unavailable Alert
Instances: 253
10.4.11.4 Average Line-Neutral Voltage
Monitors the average line to neutral RMS voltage of the AC power from a Utility across all phases.
Alert Types: Low Alert, High Alert, Data Unavailable Alert
Instances: 253
10.4.11.5 Phase A Apparent Power
Monitors the Apparent Power being sourced from a Utility on phase A.
Alert Types: Low Alert, High Alert, Data Unavailable Alert
Instances: 253
10.4.11.6 Phase A Current
Monitors the AC RMS electrical current being sourced from a Utility on phase A.
Alert Types: Low Alert, High Alert, Data Unavailable Alert
Instances: 253
10.4.11.7 Phase A Frequency
Monitors the frequency of phase A of a Utility.
Alert Types: Low Alert, High Alert, Data Unavailable Alert
Instances: 253
10.4.11.8 Phase A Line-Neutral Voltage
Monitors the RMS voltage between Phase A and neutral of a Utility.
Alert Types: Low Alert, High Alert, Data Unavailable Alert
Instances: 253
10.4.11.9 Phase A Power Factor
Monitors the Power Factor of Phase A of a Utility.
Alert Types: Low Alert, High Alert, Data Unavailable Alert
Instances: 253
10.4.11.10 Phase A Reactive Power
Monitors the Reactive Power on Phase A of a Utility.
Alert Types: Low Alert, High Alert, Data Unavailable Alert
Instances: 253
10.4.11.11 Phase A Real Power
Monitors the Real Power on Phase A of a Utility.
Alert Types: Low Alert, High Alert, Data Unavailable Alert
Instances: 253
10.4.11.12 Phase AB Line-Line Voltage
Monitors the RMS voltage between Phase A and Phase B of a Utility.
Alert Types: Low Alert, High Alert, Data Unavailable Alert
Instances: 253
10.4.11.13 Phase B Apparent Power
Monitors the Apparent Power being sourced from a Utility on phase B.
Alert Types: Low Alert, High Alert, Data Unavailable Alert
Instances: 253
10.4.11.14 Phase B Current
Monitors the AC RMS electrical current being sourced from a Utility on phase B.
Alert Types: Low Alert, High Alert, Data Unavailable Alert
Instances: 253
10.4.11.15 Phase B Frequency
Monitors the frequency of phase B of a Utility.
Alert Types: Low Alert, High Alert, Data Unavailable Alert
Instances: 253
10.4.11.16 Phase B Line-Neutral Voltage
Monitors the RMS voltage between Phase B and neutral of a Utility.
Alert Types: Low Alert, High Alert, Data Unavailable Alert
Instances: 253
10.4.11.17 Phase B Power Factor
Monitors the Power Factor of Phase B of a Utility.
Alert Types: Low Alert, High Alert, Data Unavailable Alert
Instances: 253
10.4.11.18 Phase B Reactive Power
Monitors the Reactive Power on Phase B of a Utility.
Alert Types: Low Alert, High Alert, Data Unavailable Alert
Instances: 253
10.4.11.19 Phase B Real Power
Monitors the Real Power on Phase B of a Utility.
Alert Types: Low Alert, High Alert, Data Unavailable Alert
Instances: 253
10.4.11.20 Phase BC Line-Line Voltage
Monitors the RMS voltage between Phase B and Phase C of a Utility.
Alert Types: Low Alert, High Alert, Data Unavailable Alert
Instances: 253
10.4.11.21 Phase C Apparent Power
Monitors the Apparent Power being sourced from a Utility on phase C.
Alert Types: Low Alert, High Alert, Data Unavailable Alert
Instances: 253
10.4.11.22 Phase C Current
Monitors the AC RMS electrical current being sourced from a Utility on phase C.
Alert Types: Low Alert, High Alert, Data Unavailable Alert
Instances: 253
10.4.11.23 Phase C Frequency
Monitors the frequency of phase C of a Utility.
Alert Types: Low Alert, High Alert, Data Unavailable Alert
Instances: 253
10.4.11.24 Phase C Line-Neutral Voltage
Monitors the RMS voltage between Phase C and neutral of a Utility.
Alert Types: Low Alert, High Alert, Data Unavailable Alert
Instances: 253
10.4.11.25 Phase C Power Factor
Monitors the Power Factor of Phase C of a Utility.
Alert Types: Low Alert, High Alert, Data Unavailable Alert
Instances: 253
10.4.11.26 Phase C Reactive Power
Monitors the Reactive Power on Phase C of a Utility.
Alert Types: Low Alert, High Alert, Data Unavailable Alert
Instances: 253
10.4.11.27 Phase C Real Power
Monitors the Real Power on Phase C of a Utility.
Alert Types: Low Alert, High Alert, Data Unavailable Alert
Instances: 253
10.4.11.28 Phase CA Line-Line Voltage
Monitors the RMS voltage between Phase C and Phase A of a Utility.
Alert Types: Low Alert, High Alert, Data Unavailable Alert
Instances: 253
10.4.11.29 Total Apparent Power
Monitors the Total Apparent Power being sourced from a Utility on all phases.
Alert Types: Low Alert, High Alert, Data Unavailable Alert
Instances: 253
10.4.11.30 Total Power Factor
Monitors the Total Power Factor of a Utility across all phases.
Alert Types: Low Alert, High Alert, Data Unavailable Alert
Instances: 253
10.4.11.31 Total Reactive Power
Monitors the Total Reactive Power on all phases of a Utility.
Alert Types: Low Alert, High Alert, Data Unavailable Alert
Instances: 253
10.4.11.32 Total Real Power
Monitors the Total Real Power on all phases of a Utility.
Alert Types: Low Alert, High Alert, Data Unavailable Alert
Instances: 253
10.4.11.33 Total kWh Export
Monitors the Total kilowatt-hours exported from a Utility.
Alert Types: Low Alert, High Alert, Data Unavailable Alert
Instances: 253
10.4.11.34 Total kWh Import
Monitors the Total kilowatt-hours imported to a Utility.
Alert Types: Low Alert, High Alert, Data Unavailable Alert
Instances: 253
10.4.12 Anchor
10.4.12.1 Anchor Watch
Monitors the vessel position relative to a preset Latitude and Longitude. Multiple Anchor Watch Alerts may be entered into the system with different Trigger and Clear Points and different actions. The Anchoring Module will set the Latitude and Longitude of all the points when the Anchor is dropped, and will also set the Trigger and Clear Point of the Anchor Watch Alert with the highest priority (lowest priority number)
Alert Types: Anchor Watch Alert
Instances: not applicable
10.4.13 Charger
10.4.13.1 Charge Mode
Monitors the Charger Mode.
Alert Types: Data Unavailable Alert
Instances: 253
10.4.13.2 Charger Eq. Pending
Monitors the Charger Equalizer Pending State.
Alert Types: Off Alert, On Alert, Data Unavailable Alert
Instances: 253
10.4.13.3 Charger Eq. Time Remaining
Monitors the time left for the Charger Equalizer Pending State.
Alert Types: Low Alert, High Alert, Data Unavailable Alert
Instances: 253
10.4.13.4 Converter Low DC State
Monitors the Converter Low DC Voltage State.
Alert Types: Off Alert, On Alert, Data Unavailable Alert
Instances: 253
10.4.13.5 Converter Operating State
Monitors the Converter Operating State.
Alert Types: Data Unavailable Alert
Instances: 253
10.4.13.6 Converter Overload
Monitors the Converter for a reported overload condition.
Alert Types: Off Alert, On Alert, Data Unavailable Alert
Instances: 253
10.4.13.7 Converter Ripple State
Monitors the Converter for the Charger Ripple fault condition.
Alert Types: Off Alert, On Alert, Data Unavailable Alert
Instances: 253
10.4.13.8 Converter Temperature State
Monitors the Converter for the High Temperature condition.
Alert Types: Off Alert, On Alert, Data Unavailable Alert
Instances: 253
10.4.14 DC
10.4.14.1 Battery AH Remaining
Monitors the estimated Amp Hours remaining in the battery.
Alert Types: Low Alert, High Alert, Data Unavailable Alert
Instances: 253
10.4.14.2 Battery State of Charge
Monitors the current energy in the battery as a percentage of its total capacity
Alert Types: Low Alert, High Alert, Data Unavailable Alert
Instances: 253
10.4.14.3 Battery State of Health
Monitors the current battery State of Health as a percentage.
Alert Types: Low Alert, High Alert, Data Unavailable Alert
Instances: 253
10.4.14.4 Battery Temperature
Monitors the battery case temperature
Alert Types: Low Alert, High Alert, Data Unavailable Alert
Instances: 253
10.4.14.5 Battery Time Remaining
Monitors the time remaining that the battery can continue to operate at its current load
Alert Types: Low Alert, High Alert, Data Unavailable Alert
Instances: 253
10.4.14.6 Current
Monitors the electrical current being sourced to/from the battery
Alert Types: Low Alert, High Alert, Data Unavailable Alert
Instances: 253
10.4.14.7 Power
Monitors the DC power currently being provided by the battery
Alert Types: Low Alert, High Alert, Data Unavailable Alert
Instances: 253
10.4.14.8 Voltage
Monitors the voltage measured at the battery
Alert Types: Low Alert, High Alert, Data Unavailable Alert
Instances: 253
10.4.14.9 Ripple Voltage
Monitors the ripple voltage at the battery
Alert Types: Low Alert, High Alert, Data Unavailable Alert
Instances: 253
10.4.15 Electrical
10.4.15.1 Resistance
Monitors the resistance value sent by a CLM100.
Alert Types: Low Alert, High Alert, Data Unavailable Alert
Instances: 253
10.4.16 Depth
10.4.16.1 Water Below Transducer
Monitors the current reading from a depth transducer.
Alert Types: Low Alert, High Alert, Data Unavailable Alert
Instances: 253
10.4.16.2 Water Depth (includes offset)
Monitors the current reading from a depth transducer, plus the offset of the depth transducer.
Alert Types: Low Alert, High Alert, Data Unavailable Alert
Instances: 253
10.4.17 Electrical Distribution
10.4.17.1 Switch/Circuit Breaker
Monitors whether the specified breaker is on, off, or tripped
Alert Types: On Alert, Off Alert, Tripped Alert, Data Unavailable Alert
Instances: 253
Switches (Per Instance): 28
10.4.17.2 Dimmer
Monitors whether the specified dimmer is transmitting data.
Alert Types: Data Unavailable Alert
Instances: 253
Switches (Per Instance): 28
10.4.17.3 Hardware Counter
Monitors whether the count of the number of times the Switch/Breaker has been switched ON exceeds a specified value. There is no Clear Value for this Alert; it will be cleared when the count is reset in the device.
Alert Types: High Alert, Data Unavailable Alert
Instances: 253
Switches (Per Instance): 28
10.4.17.4 Hardware Timer
Monitors whether the cumulative ON time of the Switch/Breaker exceeds a specified value. There is no Clear Value for this Alert; it will be cleared when the timer is reset in the device.
Alert Types: High Alert, Data Unavailable Alert
Instances: 253
Switches (Per Instance): 28
10.4.17.5 Phase A AC Current
For AC Breaker boxes that are capable of supplying Phase information, this alert monitors the value of the current flowing in the phase.
Alert Types: High Alert, Low Alert, Data Unavailable Alert
Units: Amps
Instances: 253
Switches (Per Instance): 28
10.4.17.6 Phase A AC Frequency
For AC Breaker boxes that are capable of supplying Phase information, this alert monitors the value of the frequency of the phase.
Alert Types: High Alert, Low Alert, Data Unavailable Alert
Units: Hz
Instances: 253
Switches (Per Instance): 28
10.4.17.7 Phase A L-N AC Voltage
For AC Breaker boxes that are capable of supplying Phase information, this alert monitors the value of the voltage of the phase, relative to neutral.
Alert Types: High Alert, Low Alert, Data Unavailable Alert
Units: Volts
Instances: 253
Switches (Per Instance): 28
10.4.17.8 Phase A Real AC Power
For AC Breaker boxes that are capable of supplying Phase information, this alert monitors the value of the power drawn by the phase.
Alert Types: High Alert, Low Alert, Data Unavailable Alert
Units: Kilowatts, Watts
Instances: 253
Switches (Per Instance): 28
10.4.17.9 Phase AB L-L AC Voltage
For AC Breaker boxes that are capable of supplying Phase information, this alert monitors displays the value of the voltage between phases A and B.
Alert Types: High Alert, Low Alert, Data Unavailable Alert
Units: Volts
Instances: 253
Switches (Per Instance): 28
10.4.17.10 Phase B AC Current
For AC Breaker boxes that are capable of supplying Phase information, this alert monitors the value of the current flowing in the phase.
Alert Types: High Alert, Low Alert, Data Unavailable Alert
Units: Amps
Instances: 253
Switches (Per Instance): 28
10.4.17.11 Phase B AC Frequency
For AC Breaker boxes that are capable of supplying Phase information, this alert monitors the value of the frequency of the phase.
Alert Types: High Alert, Low Alert, Data Unavailable Alert
Units: Hz
Instances: 253
Switches (Per Instance): 28
10.4.17.12 Phase B L-N AC Voltage
For AC Breaker boxes that are capable of supplying Phase information, this alert monitors the value of the voltage of the phase, relative to neutral.
Alert Types: High Alert, Low Alert, Data Unavailable Alert
Units: Volts
Instances: 253
Switches (Per Instance): 28
10.4.17.13 Phase B Real AC Power
For AC Breaker boxes that are capable of supplying Phase information, this alert monitors the value of the power drawn by the phase.
Alert Types: High Alert, Low Alert, Data Unavailable Alert
Units: Kilowatts, Watts
Instances: 253
Switches (Per Instance): 28
10.4.17.14 Phase BC L-L AC Voltage
For AC Breaker boxes that are capable of supplying Phase information, this alert monitors displays the value of the voltage between phases B and C.
Alert Types: High Alert, Low Alert, Data Unavailable Alert
Units: Volts
Instances: 253
Switches (Per Instance): 28
10.4.17.15 Phase C AC Current
For AC Breaker boxes that are capable of supplying Phase information, this alert monitors the value of the current flowing in the phase.
Alert Types: High Alert, Low Alert, Data Unavailable Alert
Units: Amps
Instances: 253
Switches (Per Instance): 28
10.4.17.16 Phase C AC Frequency
For AC Breaker boxes that are capable of supplying Phase information, this alert monitors the value of the frequency of the phase.
Alert Types: High Alert, Low Alert, Data Unavailable Alert
Units: Hz
Instances: 253
Switches (Per Instance): 28
10.4.17.17 Phase C L-N AC Voltage
For AC Breaker boxes that are capable of supplying Phase information, this alert monitors the value of the voltage of the phase, relative to neutral.
Alert Types: High Alert, Low Alert, Data Unavailable Alert
Units: Volts
Instances: 253
Switches (Per Instance): 28
10.4.17.18 Phase C Real AC Power
For AC Breaker boxes that are capable of supplying Phase information, this alert monitors the value of the power drawn by the phase.
Alert Types: High Alert, Low Alert, Data Unavailable Alert
Units: Kilowatts, Watts
Instances: 253
Switches (Per Instance): 28
10.4.17.19 Phase CA L-L AC Voltage
For AC Breaker boxes that are capable of supplying Phase information, this alert monitors displays the value of the voltage between phases C and A.
Alert Types: High Alert, Low Alert, Data Unavailable Alert
Units: Volts
Instances: 253
Switches (Per Instance): 28
10.4.17.20 Switch/ Breaker Current
Monitors the current reported by the switch / breaker when the switch / breaker is tuned ON
Alert Types: Burnt Our Bulb Alert, Low Current When On Alert, High Current When On Alert
Instances: 253
Switches (Per Instance): 28
10.4.17.21 Switch/ Breaker Group
Monitors if the switch statuses set in the Group have been met.
Alert Types: On Alert, Off Alert
Groups: 28
10.4.17.22 Switch/ Breaker Voltage
Monitors the voltage reported by the switch / breaker.
Alert Types: High Alert, Low Alert, Data Unavailable Alert
Instances: 253
Switches (Per Instance): 28
10.4.18 Engine
10.4.18.1 Engine Boost Pressure
Monitors the boost pressure of a supercharger or turbocharger.
Alert Types: Low Alert, High Alert, Data Unavailable Alert
Instances: 253
10.4.18.2 Engine Coolant Pressure
Monitors the engine’s water/coolant pressure
Alert Types: Low Alert, High Alert, Data Unavailable Alert
Instances: 253
10.4.18.3 Engine Coolant Temperature
Monitors the engine’s water/coolant temperature
Alert Types: Low Alert, High Alert, Data Unavailable Alert
Instances: 253
10.4.18.4 Engine Fuel Pressure
Monitors the pressure of the fuel for the engine.
Alert Types: Low Alert, High Alert, Data Unavailable Alert
Instances: 253
10.4.18.5 Engine Hours
Monitors the number of hours of operation reported by the engine
Alert Types: High Alert, Data Unavailable Alert
Instances: 253
10.4.18.6 Engine Oil Pressure
Monitors the engine’s oil pressure
Alert Types: Low Alert, High Alert, Data Unavailable Alert
Instances: 253
10.4.18.7 Engine Oil Temperature
Monitors the engine’s oil temperature
Alert Types: Low Alert, High Alert, Data Unavailable Alert
Instances: 253
10.4.18.8 Engine Voltage
Monitors the voltage produced by the engine’s generator / alternator
Alert Types: Low Alert, High Alert, Data Unavailable Alert
Instances: 253
10.4.18.9 Exhaust Gas Temperature
Monitors the temperature of the engine’s exhaust gases.
Alert Types: Low Alert, High Alert, Data Unavailable Alert
Instances: 253
10.4.18.10 Fuel Consumption (Vol./Dis.)
Monitors the engine’s fuel consumption
Alert Types: Low Alert, High Alert, Data Unavailable Alert
Instances: 253
10.4.18.11 Fuel Economy (Dis./Vol.)
Monitors the engine’s fuel usage
Alert Types: Low Alert, High Alert, Data Unavailable Alert
Instances: 253
10.4.18.12 Fuel Rate
Monitors the rate of fuel consumption for the engine
Alert Types: Low Alert, High Alert, Data Unavailable Alert
Instances: 253
10.4.18.13 Percent Load
Monitors the current load on the engine as a percentage of its rated load
Alert Types: Low Alert, High Alert, Data Unavailable Alert
Instances: 253
10.4.18.14 Percent Torque
Monitors the current torque being provided by the engine as a percentage of its rated torque
Alert Types: Low Alert, High Alert, Data Unavailable Alert
Instances: 253
10.4.18.15 Tachometer
Monitors the rotational speed of the engine
Alert Types: Low Alert, High Alert, Data Unavailable Alert
Instances: 253
10.4.18.16 Tilt/Trim
Monitors the tilt or trim of the drive
Alert Types: Low Alert, High Alert, Data Unavailable Alert
Instances: 253
10.4.18.17 Trip Fuel Used
Monitors the fuel used since the last reset
Alert Types: Low Alert, High Alert, Data Unavailable Alert
Instances: 253
10.4.19 Engine Warning
10.4.19.1 Charge
Generally indicates a fault in the engine’s charging system. Please consult the engine manufacturer’s documentation for details.
Alert Types: On Alert, Off Alert, Data Unavailable Alert
Instances: 253
10.4.19.2 Check Engine
Generally indicates some condition in the engine that requires investigation. Please consult the engine manufacturer’s documentation for details.
Alert Types: On Alert, Off Alert, Data Unavailable Alert
Instances: 253
10.4.19.3 Comm Error
Generally indicates some condition relative to engine communications that requires investigation. Please consult the engine manufacturer’s documentation for details.
Alert Types: On Alert, Off Alert, Data Unavailable Alert
Instances: 253
10.4.19.4 Cranking
Generally indicates that the starter on the engine is engaged Please consult the engine manufacturer’s documentation for details.
Alert Types: On Alert, Off Alert, Data Unavailable Alert
Instances: 253
10.4.19.5 EGR System
Generally indicates a fault in the exhaust gas recirculation (EGR) system. Please consult the engine manufacturer’s documentation for details.
Alert Types: On Alert, Off Alert, Data Unavailable Alert
Instances: 253
10.4.19.6 Emergency Stop
Generally indicates that the engine was stopped using an emergency stop button. Please consult the engine manufacturer’s documentation for details.
Alert Types: On Alert, Off Alert, Data Unavailable Alert
Instances: 253
10.4.19.7 High Boost
Generally indicates that the supercharger/turbocharger boost pressure has exceeded some engine-defined limit. Please consult the engine manufacturer’s documentation for details.
Alert Types: On Alert, Off Alert, Data Unavailable Alert
Instances: 253
10.4.19.8 Low Coolant Level
Generally indicates that the level of coolant has fallen below some engine-defined limit. Please consult the engine manufacturer’s documentation for details.
Alert Types: On Alert, Off Alert, Data Unavailable Alert
Instances: 253
10.4.19.9 Low Fuel Pressure
Generally indicates that the fuel pressure has fallen below some engine-defined limit. Please consult the engine manufacturer’s documentation for details.
Alert Types: On Alert, Off Alert, Data Unavailable Alert
Instances: 253
10.4.19.10 Low Oil Level
Generally indicates that the oil level has fallen below some user-defined limit. Please consult the engine manufacturer’s documentation for details.
Alert Types: On Alert, Off Alert, Data Unavailable Alert
Instances: 253
10.4.19.11 Low Oil Pressure
Generally indicates that the oil pressure has fallen below some user-defined limit. Please consult the engine manufacturer’s documentation for details.
Alert Types: On Alert, Off Alert, Data Unavailable Alert
Instances: 253
10.4.19.12 Low System Voltage
Generally indicates that the system voltage has fallen below some user-defined limit. Please consult the engine manufacturer’s documentation for details.
Alert Types: On Alert, Off Alert, Data Unavailable Alert
Instances: 253
10.4.19.13 Maintenance Needed
Generally indicates that the engine is in need of maintenance. Please consult the engine manufacturer’s documentation for details.
Alert Types: On Alert, Off Alert, Data Unavailable Alert
Instances: 253
10.4.19.14 Neutral Start Protect
Generally indicates that the engine will not start because the transmission is not in neutral. Please consult the engine manufacturer’s documentation for details.
Alert Types: On Alert, Off Alert, Data Unavailable Alert
Instances: 253
10.4.19.15 Over Temperature
Generally indicates that the engine’s temperature has exceeded some engine-defined limit. Please consult the engine manufacturer’s documentation for details.
Alert Types: On Alert, Off Alert, Data Unavailable Alert
Instances: 253
10.4.19.16 Power Reduction
Generally indicates that the engine is operating in a reduced-power mode due to some fault condition. Please consult the engine manufacturer’s documentation for details.
Alert Types: On Alert, Off Alert, Data Unavailable Alert
Instances: 253
10.4.19.17 Preheat
Generally indicates that the cylinder preheaters are active. Please consult the engine manufacturer’s documentation for details.
Alert Types: On Alert, Off Alert, Data Unavailable Alert
Instances: 253
10.4.19.18 Rev Limit Exceeded
Generally indicates that the engine’s RPM has exceeded some engine-defined limit. Please consult the engine manufacturer’s documentation for details.
Alert Types: On Alert, Off Alert, Data Unavailable Alert
Instances: 253
10.4.19.19 Shutting Down
Generally indicates that the engine is in the process of shutting down. Please consult the engine manufacturer’s documentation for details.
Alert Types: On Alert, Off Alert, Data Unavailable Alert
Instances: 253
10.4.19.20 Sub/Secondary Throttle
Generally indicates that the engine has fallen back to a secondary throttle due to some fault detected in the primary throttle. Please consult the engine manufacturer’s documentation for details.
Alert Types: On Alert, Off Alert, Data Unavailable Alert
Instances: 253
10.4.19.21 Throttle Position Sensor
Generally indicates a fault in the throttle position sensor. Please consult the engine manufacturer’s documentation for details.
Alert Types: On Alert, Off Alert, Data Unavailable Alert
Instances: 253
10.4.19.22 Warning Level 1
Generally indicates some engine-specific warning condition. Please consult the engine manufacturer’s documentation for details.
Alert Types: On Alert, Off Alert, Data Unavailable Alert
Instances: 253
10.4.19.23 Warning Level 2
Generally indicates some engine-specific warning condition. Please consult the engine manufacturer’s documentation for details.
Alert Types: On Alert, Off Alert, Data Unavailable Alert
Instances: 253
10.4.19.24 Water Flow
Generally indicates a lack of water flow in cooling system. Please consult the engine manufacturer’s documentation for details.
Alert Types: On Alert, Off Alert, Data Unavailable Alert
Instances: 253
10.4.19.25 Water In Fuel
Generally indicates that water has been detected in the engine’s fuel. Please consult the engine manufacturer’s documentation for details.
Alert Types: On Alert, Off Alert, Data Unavailable Alert
Instances: 253
10.4.20 Environment
10.4.20.1 Bait Well Temperature
Monitors the temperature from a temperature sensor set up with a source of “Bait Well”.
Alert Types: Low Alert, High Alert, Data Unavailable Alert
Instances: 253
10.4.20.2 Barometric Pressure
Monitors the atmospheric (barometric) pressure
Alert Types: Low Alert, High Alert, Data Unavailable Alert
Instances: 253
10.4.20.3 Dew Point
Monitors the current dew point based on outside air temperature and humidity
Alert Types: Low Alert, High Alert, Data Unavailable Alert
10.4.20.4 Engine Room Temperature
Monitors the temperature from a temperature sensor set up with a source of “Engine Room”.
Alert Types: Low Alert, High Alert, Data Unavailable Alert
Instances: 253
10.4.20.5 Heat Index
Monitors the current heat index based on outside air temperature and humidity
Alert Types: Low Alert, High Alert, Data Unavailable Alert
Instances: 253
10.4.20.6 Inside Humidity
Monitors the relative humidity from a humidity sensor set up with a source of “Inside”.
Alert Types: Low Alert, High Alert, Data Unavailable Alert
Instances: 253
10.4.20.7 Inside Temperature
Monitors the temperature from a temperature sensor set up with a source of “Inside”.
Alert Types: Low Alert, High Alert, Data Unavailable Alert
Instances: 253
10.4.20.8 Live Well Temperature
Monitors the temperature from a temperature sensor set up with a source of “Live Well”.
Alert Types: Low Alert, High Alert, Data Unavailable Alert
Instances: 253
10.4.20.9 Main Cabin Temperature
Monitors the temperature from a temperature sensor set up with a source of “Main Cabin”.
Alert Types: Low Alert, High Alert, Data Unavailable Alert
Instances: 253
10.4.20.10 Outside Humidity
Monitors the relative humidity from a humidity sensor set up with a source of “Outside”.
Alert Types: Low Alert, High Alert, Data Unavailable Alert
Instances: 253
10.4.20.11 Outside Temperature
Monitors the temperature from a temperature sensor set up with a source of “outside”.
Alert Types: Low Alert, High Alert, Data Unavailable Alert
Instances: 253
10.4.20.12 Sea Temperature
Monitors the temperature from a temperature sensor set up with a source of “Sea”.
Alert Types: Low Alert, High Alert, Data Unavailable Alert
Instances: 253
10.4.20.13 User Defined nnn Humidity
Monitors the relative humidity from a humidity sensor set up with a source of “User Defined nnn”, where nnn is a number from 128 to 144.
Alert Types: Low Alert, High Alert, Data Unavailable Alert
Instances: 253
10.4.20.14 User Defined nnn Temperature
Monitors the temperature from a temperature sensor set up with a source of “User Defined nnn” , where nnn is a number from 128 to 144..
Alert Types: Low Alert, High Alert, Data Unavailable Alert
Instances: 253
10.4.20.15 Wind Chill
Monitors the current wind chill based on outside air temperature and wind speed
Alert Types: Low Alert, High Alert, Data Unavailable Alert
10.4.21 GPS
10.4.21.1 Course Over Ground
Monitors the current course over ground
Alert Types: Direction Alert, Data Unavailable Alert
Instances: 253
10.4.21.2 GPS Status
Monitors the current operating mode and status of the currently selected GPS received (please see Section 9.5.13 on page 148 for more details)
Alert Types: GPS Quality Alert, Data Unavailable Alert
Instances: 253
10.4.21.3 Lat / Lon
Monitors the current latitude and longitude of the vessel
Alert Types: Inside Radius Alert, Outside Radius Alert, Data Unavailable Alert
Instances: 253
10.4.21.4 Speed Over Ground
Monitors the current speed over ground
Alert Types: Low Alert, High Alert, Data Unavailable Alert
Instances: 253
10.4.22 Heading
10.4.22.1 Heading
Monitors the current heading of the vessel (the direction the vessel is pointing) relative to true or magnetic north depending on the unit setting of the heading parameter (see Section 9.4.8.3.2).
Alert Types: Direction Alert, Data Unavailable Alert
Instances: 253
10.4.22.2 Rate of Turn
Monitors the change in Heading of the vessel
Alert Types: High Alert, Data Unavailable Alert
Instances: 253
10.4.22.3 Variation
Monitors the compass variation (Angle between True North and Magnetic North).
Alert Types: Data Unavailable Alert
Instances: 253
10.4.23 Humidity
10.4.23.1 Inside Humidity
Monitors the relative humidity from a humidity sensor set up with a source of “Inside”.
Alert Types: Low Alert, High Alert, Data Unavailable Alert
Instances: 253
10.4.23.2 Outside Humidity
Monitors the relative humidity from a humidity sensor set up with a source of “Outside”.
Alert Types: Low Alert, High Alert, Data Unavailable Alert
Instances: 253
10.4.23.3 User Defined nnn Humidity
Monitors the relative humidity from a humidity sensor set up with a source of “User Defined nnn”, where nnn is a number from 128 to 144.
Alert Types: Low Alert, High Alert, Data Unavailable Alert
Instances: 253
10.4.24 Indicator
10.4.24.1 Hardware Counter
Monitors whether the count of the number of times the Indicator has been ON exceeds a specified value. There is no Clear Value for this Alert; it will be cleared when the count is reset in the device.
Alert Types: High Alert, Data Unavailable Alert
Instances: 253
Switches (Per Instance): 28
10.4.24.2 Hardware Timer
Monitors whether the cumulative ON time of the Indicator exceeds a specified value. There is no Clear Value for this Alert; it will be cleared when the timer is reset in the device.
Alert Types: High Alert, Data Unavailable Alert
Instances: 253
Switches (Per Instance): 28
10.4.24.3 Status
Monitors the status of a switch indicator or run indicator on the system.
Alert Types: On Alert, Off Alert, Error Alert, Data Unavailable Alert
Instances: 253
Switches (Per Instance): 28
10.4.24.4 Switch / Breaker Group Status
Monitors the status of a group of Breakers defined as a Switch / Breaker Group and Alerts when the breakers meet the requirements of the Group (ON) or not (OFF).
Alert Types: On Alert, Off Alert
Instances: 253
Switches (Per Instance): 28
10.4.25 Inverter
10.4.25.1 Inverter Enabled
Monitors the status of an inverter to see if it is enabled
Alert Types: On Alert, Off Alert, Data Unavailable Alert
Instances: 253
Switches (Per Instance): 28
10.4.25.2 Inverter Operating State
Monitors the operating state of an inverter to see if it is on line.
Alert Types: Data Unavailable Alert
Instances: 253
Switches (Per Instance): 28
10.4.26 Mechanical
10.4.26.1 Decibel
Monitors the decibel level sent from the CLM100.
Alert Types: High Alert, Low Alert, Data Unavailable Alert
Instances: 253
10.4.26.2 Force
Monitors the force values level sent from the CLM100.
Alert Types: High Alert, Low Alert, Data Unavailable Alert
Instances: 253
10.4.26.3 Strain
Monitors the strain values sent from the CLM100.
Alert Types: High Alert, Low Alert, Data Unavailable Alert
Instances: 253
10.4.27 Motion
10.4.27.1 Acceleration
Monitors the acceleration values level sent from the CLM100.
Alert Types: High Alert, Low Alert, Data Unavailable Alert
Instances: 253
10.4.27.2 Angle
Monitors the angle values level sent from the CLM100.
Alert Types: High Alert, Low Alert, Data Unavailable Alert
Instances: 253
10.4.27.3 Angular Acceleration
Monitors the angular acceleration values level sent from the CLM100.
Alert Types: High Alert, Low Alert, Data Unavailable Alert
Instances: 253
10.4.27.4 Angular Velocity
Monitors the angular velocity values level sent from the CLM100.
Alert Types: High Alert, Low Alert, Data Unavailable Alert
Instances: 253
10.4.27.5 Distance
Monitors the distance values level sent from the CLM100.
Alert Types: High Alert, Low Alert, Data Unavailable Alert
Instances: 253
10.4.27.6 Rotation Rate
Monitors the rotation rate values level sent from the CLM100.
Alert Types: High Alert, Low Alert, Data Unavailable Alert
Instances: 253
10.4.27.7 Velocity
Monitors the velocity values level sent from the CLM100.
Alert Types: High Alert, Low Alert, Data Unavailable Alert
Instances: 253
10.4.28 NMEA 2000 – N2KView Connection
10.4.28.1 Cloud Server Data Remaining
Monitors the amount of Data Bandwidth remaining to the Cloud Server for the current month.
Alert Types: Low Alert, High Alert
Instances: not applicable
10.4.28.2 Cloud Server Data Used
Monitors the amount of Data Bandwidth used to the Cloud Server for the current month.
Alert Types: Low Alert, High Alert
Instances: not applicable
10.4.28.3 Cloud Server Percent Remaining
Monitors the percentage of Data Bandwidth remaining to the Cloud Server for the current month.
Alert Types: Low Alert, High Alert
Instances: not applicable
10.4.28.4 Cloud Server Percent Used
Monitors the percentage of Data Bandwidth used to the Cloud Server for the current month.
Alert Types: Low Alert, High Alert
Instances: not applicable
10.4.28.5 NMEA 2000 Connection
Monitors the status of the connection to the NMEA 2000 bus.
Alert Types: Server Disconnected Alert
Instances: not applicable
10.4.28.6 NMEA 2000 Connection (CAN 2)
On the dual bus MBB300C, TSM800C, TSM810C, and TSM1330C units, this alert can monitor the status of the connection to the second NMEA 2000 bus.
Alert Types: Server Disconnected Alert
Instances: not applicable
10.4.29 Navigation
N2KView is not a primary navigator; that is, it does not provide means for entering and storing waypoint and route data. N2KView can receive information on the current leg of the voyage from a primary navigation device (such as a chart plotter or PC with navigation software and NMEA 2000 interface) and display the following information:
10.4.29.1 Bearing Origin to Destination
Monitors the direction from the origin waypoint to the destination waypoint
Alert Types: Direction Alert, Data Unavailable Alert
10.4.29.2 Bearing to Waypoint
Monitors the bearing to the destination waypoint
Alert Types: Direction Alert, Data Unavailable Alert
10.4.29.3 Course Over Ground
Monitors the current course over ground
Alert Types: Course Alert, Data Unavailable Alert
Instances: 253
10.4.29.4 Cross Track Error
Monitors the cross-track error (minimum distance from the boat to the programmed route)
Alert Types: High Alert, Data Unavailable Alert
Units: kilometers, nautical miles, statute miles
10.4.29.5 Destination Waypoint Number
Monitors the number of the destination waypoint
Alert Types: Data Unavailable Alert
10.4.29.6 Distance to Waypoint
Monitors the distance to the destination waypoint
Alert Types: Low Alert, Data Unavailable Alert
Units: kilometers, nautical miles, statute miles
10.4.29.7 Lat / Lon
Monitors the current latitude and longitude of the vessel
Alert Types: Inside Radius Alert, Outside Radius Alert, Data Unavailable Alert
Instances: 253
10.4.29.8 Speed Over Ground
Monitors the current speed over ground of the vessel
Alert Types: Low Alert, High Alert, Data Unavailable Alert
Instances: 253
10.4.29.9 Time to Go
Monitors the estimated time remaining until arrival at the destination waypoint assuming current speed and course remain constant
Alert Types: Low Alert, High Alert, Data Unavailable Alert
10.4.29.10 Velocity to Waypoint
Monitors the speed at which the distance to the waypoint is decreasing
Alert Types: Low Alert, High Alert, Data Unavailable Alert
10.4.30 Pressure / Vacuum
10.4.30.1 Barometric Pressure
Monitors the atmospheric (barometric) pressure
Alert Types: Low Alert, High Alert, Data Unavailable Alert
Instances: 253
10.4.30.2 Compressed Air Pressure
Monitors the pressure from a pressure sensor set up with a source of “Compressed Air”
Alert Types: Low Alert, High Alert, Data Unavailable Alert
Instances: 253
10.4.30.3 Engine Boost Pressure
Monitors the boost pressure of a supercharger or turbocharger.
Alert Types: Low Alert, High Alert, Data Unavailable Alert
Instances: 253
10.4.30.4 Engine Coolant Pressure
Monitors the engine’s water/coolant pressure
Alert Types: Low Alert, High Alert, Data Unavailable Alert
Instances: 253
10.4.30.5 Engine Fuel Pressure
Monitors the pressure of the fuel for the engine.
Alert Types: Low Alert, High Alert, Data Unavailable Alert
Instances: 253
10.4.30.6 Engine Oil Pressure
Monitors the engine’s oil pressure
Alert Types: Low Alert, High Alert, Data Unavailable Alert
Instances: 253
10.4.30.7 Hydraulic Oil Pressure
Monitors the pressure from a pressure sensor set up with a
source of “Hydraulic
Oil”
Alert Types: Low Alert, High Alert, Data Unavailable Alert
Instances: 253
10.4.30.8 Steam Pressure
Monitors the pressure from a pressure sensor set up with a source of “Steam”
Alert Types: Low Alert, High Alert, Data Unavailable Alert
Instances: 253
10.4.30.9 Transmission Oil Pressure
Monitors the pressure of the oil in the transmission
Alert Types: Low Alert, High Alert, Data Unavailable Alert
Instances: 253
10.4.30.10 User Defined Pressure
Monitors the pressure of a user defined fluid type
Alert Types: Low Alert, High Alert, Data Unavailable Alert
Instances: 253
10.4.31 Rudder
10.4.31.1 Angle
Monitors the angle of the vessel’s rudder as indicated by the rudder sensor
Alert Types: High Alert, Data Unavailable Alert
Units: degrees
Instances: 4
10.4.32 SMS (Text)
10.4.32.1 SMS Status
Monitors the status of the SMS100 module.
Alert Types: Data Unavailable Alert
Units: n/a
Instances: n/a
10.4.32.2 SMS Message Alert
Alerts when the SMS100 receives a message and passes it to N2KView.
Alert Types: SMS Message Alert
Units: n/a
Instances: n/a
10.4.33 Speed/Distance
10.4.33.1 Speed Over Ground
Monitors the speed over ground of the vessel (relative to the earth, not the water)
Alert Types: Low Alert, High Alert, Data Unavailable Alert
Instances: 253
10.4.33.2 Speed Through Water
Monitors the speed of the boat relative to the water
Alert Types: Low Alert, High Alert, Data Unavailable Alert
Instances: 253
10.4.33.3 Total Log
Monitors the total distance traveled by the vessel since the log indicator was installed
Alert Types: High Alert, Data Unavailable Alert
10.4.33.4 Trip Log
Monitors the distance traveled by the vessel since the trip indication of the log indicator was last reset
Alert Types: High Alert, Data Unavailable Alert
10.4.34 Tank
10.4.34.1 Level
Monitors the level of fluid in the tank as a percentage of its capacity
Alert Types: Low Alert, High Alert, Data Unavailable Alert
Source: Fuel, Fresh Water, Waste Water, Live Well, Oil, Black Water, Reserved 0-7
Instances: 16
10.4.34.2 Remaining
Monitors the amount of fluid in the tank
Alert Types: Low Alert, High Alert, Data Unavailable Alert
Source: Fuel, Fresh Water, Waste Water, Live Well, Oil, Black Water, Reserved 0-7
Instances: 16
10.4.35 Temperature
10.4.35.1 Bait Well Temperature
Monitors the temperature from a temperature sensor set up with a source of “Bait Well”.
Alert Types: Low Alert, High Alert, Data Unavailable Alert
Instances: 253
10.4.35.2 Battery Temperature
Monitors the battery case temperature
Alert Types: Low Alert, High Alert, Data Unavailable Alert
Instances: 253
10.4.35.3 Dew Point
Monitors the current dew point based on outside air temperature and humidity
Alert Types: Low Alert, High Alert, Data Unavailable Alert
10.4.35.4 Engine Coolant Temperature
Monitors the engine’s water/coolant temperature
Alert Types: Low Alert, High Alert, Data Unavailable Alert
Instances: 253
10.4.35.5 Engine Oil Temperature
Monitors the engine’s oil temperature
Alert Types: Low Alert, High Alert, Data Unavailable Alert
Instances: 253
10.4.35.6 Engine Room Temperature
Monitors the temperature from a temperature sensor set up with a source of “Engine Room”.
Alert Types: Low Alert, High Alert, Data Unavailable Alert
Instances: 253
10.4.35.7 Exhaust Gas Temperature
Monitors the temperature of the engine’s exhaust gases.
Alert Types: Low Alert, High Alert, Data Unavailable Alert
Instances: 253
10.4.35.8 Freezer Temperature
Monitors the temperature from a temperature sensor set up with a source of “Freezer”.
Alert Types: Low Alert, High Alert, Data Unavailable Alert
Instances: 253
10.4.35.9 Heat Index
Monitors the current heat index based on outside air temperature and humidity
Alert Types: Low Alert, High Alert, Data Unavailable Alert
Instances: 253
10.4.35.10 Heating System Temperature
Monitors the temperature from a temperature sensor set up with a source of “Heating System”.
Alert Types: Low Alert, High Alert, Data Unavailable Alert
Instances: 253
10.4.35.11 Inside Temperature
Monitors the temperature from a temperature sensor set up with a source of “Inside”.
Alert Types: Low Alert, High Alert, Data Unavailable Alert
Instances: 253
10.4.35.12 Live Well Temperature
Monitors the temperature from a temperature sensor set up with a source of “Live Well”.
Alert Types: Low Alert, High Alert, Data Unavailable Alert
Instances: 253
10.4.35.13 Main Cabin Temperature
Monitors the temperature from a temperature sensor set up with a source of “Main Cabin”.
Alert Types: Low Alert, High Alert, Data Unavailable Alert
Instances: 253
10.4.35.14 Outside Temperature
Monitors the temperature from a temperature sensor set up with a source of “Outside”.
Alert Types: Low Alert, High Alert, Data Unavailable Alert
Instances: 253
10.4.35.15 Refrigeration Temperature
Monitors the temperature from a temperature sensor set up with a source of “Refrigeration”.
Alert Types: Low Alert, High Alert, Data Unavailable Alert
Instances: 253
10.4.35.16 Sea Temperature
Monitors the temperature from a temperature sensor set up with a source of “Sea”.
Alert Types: Low Alert, High Alert, Data Unavailable Alert
Instances: 253
10.4.35.17 Shaft Seal Temperature
Monitors the temperature from a temperature sensor set up with a source of “Shaft Seal”.
Alert Types: Low Alert, High Alert, Data Unavailable Alert
Instances: 253
10.4.35.18 Transmission Oil Temperature
Monitors the temperature of the oil in the transmission
Alert Types: Low Alert, High Alert, Data Unavailable Alert
Instances: 253
10.4.35.19 User Defined nnn Temperature
Monitors the temperature from a temperature sensor set up with a source of “User Defined nnn” , where nnn is a number from 128 to 144.
Alert Types: Low Alert, High Alert, Data Unavailable Alert
Instances: 253
10.4.35.20 Wind Chill
Monitors the current wind chill based on outside air temperature and wind speed.
Alert Types: Low Alert, High Alert, Data Unavailable Alert
10.4.36 Thruster
10.4.36.1 Azimuth
Monitors the presence of azimuth reported from a rotating thruster.
Alert Types: Data Unavailable Alert
Instances: 253
Thrusters: 30 (per instance)
10.4.36.2 Boat Over Speed Warning
Monitors the presence of a Boat Over Speed Warning from a thruster.
Alert Types: On Alert, Off Alert, Data Unavailable Alert
Instances: 253
Thrusters: 30 (per instance)
10.4.36.3 Direction
Monitors the presence of direction signal reported from a thruster.
Alert Types: Data Unavailable Alert
Instances: 253
Thrusters: 30 (per instance)
10.4.36.4 High Oil Temperature Warning
Monitors the presence of a High Oil Temperature Warning from a thruster.
Alert Types: On Alert, Off Alert, Data Unavailable Alert
Instances: 253
Thrusters: 30 (per instance)
10.4.36.5 Low Controller Voltage Warning
Monitors the presence of a Low Controller Voltage Warning from a thruster.
Alert Types: On Alert, Off Alert, Data Unavailable Alert
Instances: 253
Thrusters: 30 (per instance)
10.4.36.6 Low Oil Level Warning
Monitors the presence of a Low Oil Level Warning from a thruster.
Alert Types: On Alert, Off Alert, Data Unavailable Alert
Instances: 253
Thrusters: 30 (per instance)
10.4.36.7 Motor Current
Monitors the motor current reported from a thruster.
Alert Types: Low Alert, High Alert, Data Unavailable Alert
Instances: 253
Thrusters: 30 (per instance)
10.4.36.8 Motor Operating Time
Monitors the motor operating hours reported from a thruster.
Alert Types: Low Alert, High Alert, Data Unavailable Alert
Instances: 253
Thrusters: 30 (per instance)
10.4.36.9 Motor RPM
Monitors the motor rpm reported from a thruster.
Alert Types: Low Alert, High Alert, Data Unavailable Alert
Instances: 253
Thrusters: 30 (per instance)
10.4.36.10 Motor Temperature
Monitors the motor temperature reported from a thruster.
Alert Types: Low Alert, High Alert, Data Unavailable Alert
Instances: 253
Thrusters: 30 (per instance)
10.4.36.11 Over Current Cutout
Monitors the presence of an Over Current Cutout Warning from a thruster.
Alert Types: On Alert, Off Alert, Data Unavailable Alert
Instances: 253
Thrusters: 30 (per instance)
10.4.36.12 Over Temperature Cutout
Monitors the presence of an Over Temperature Cutout Warning from a thruster.
Alert Types: On Alert, Off Alert, Data Unavailable Alert
Instances: 253
Thrusters: 30 (per instance)
10.4.36.13 Power Enable
Monitors if power has been enabled to the Thruster.
Alert Types: On Alert, Off Alert, Tripped Alert, Data Unavailable Alert
Instances: 253
Thrusters: 30 (per instance)
10.4.36.14 Retraction Status
Monitors the presence of Retraction Status data reported from a thruster.
Alert Types: Data Unavailable Alert
Instances: 253
Thrusters: 30 (per instance)
10.4.36.15 Speed
Monitors the speed reported from a thruster as a percentage of the maximum speed.
Alert Types: Low Alert, High Alert, Data Unavailable Alert
Instances: 253
Thrusters: 30 (per instance)
10.4.37 Time/Date
10.4.37.1 Time
Enables the setting of an alarm clock in any time zone.
Alert Types: Timer Alert
10.4.38 Transmission
10.4.38.1 Gear
Monitors the gear reported by the transmission. Gears are reported as 0=Forward, 1=Neutral, 2=Reverse. Low and High Alerts may be created using these numbers to detect if a transmission is in any gear.
Alert Types: Low Alert, High Alert, Data Unavailable Alert
Instances: 253
10.4.38.2 Transmission Oil Pressure
Monitors the pressure of the oil in the transmission
Alert Types: Low Alert, High Alert, Data Unavailable Alert
Instances: 253
10.4.38.3 Transmission Oil Temperature
Monitors the temperature of the oil in the transmission
Alert Types: Low Alert, High Alert, Data Unavailable Alert
Instances: 253
10.4.39 Transmission (Twin Disk)
10.4.39.1 Active Station
Monitors that the Active Station value is being reported by the transmission
Alert Types: Data Unavailable Alert
Instances: 253
10.4.39.2 Clutch Slip
Monitors the percentage Clutch Slip reported by the transmission
Alert Types: Low Alert, High Alert, Data Unavailable Alert
Instances: 253
10.4.39.3 Driveline Engaged
Monitors if the Driveline is engaged in the transmission.
Alert Types: Off Alert, On Alert, Data Unavailable Alert
Instances: 253
10.4.39.4 Input Shaft Speed
Monitors the rpm of the input shaft of the transmission.
Alert Types: Low Alert, High Alert, Data Unavailable Alert
Instances: 253
10.4.39.5 Lockup Engaged
Monitors if the transmission is in Lockup Mode.
Alert Types: Off Alert, On Alert, Data Unavailable Alert
Instances: 253
10.4.39.6 Lockup Transition
Monitors if the transmission is transitioning into Lockup Mode.
Alert Types: Off Alert, On Alert, Data Unavailable Alert
Instances: 253
10.4.39.7 Max Power Enable
Monitors if the transmission is reporting that Max Power is Enabled.
Alert Types: Off Alert, On Alert, Data Unavailable Alert
Instances: 253
10.4.39.8 Output Shaft Speed
Monitors the rpm of the output shaft of the transmission.
Alert Types: Low Alert, High Alert, Data Unavailable Alert
Instances: 253
10.4.39.9 Overspeed Enable
Monitors if the transmission is reporting that Overspeed is Enabled.
Alert Types: Off Alert, On Alert, Data Unavailable Alert
Instances: 253
10.4.39.10 Percent Command
Monitors the value of the percent command reported by the transmission.
Alert Types: Low Alert, High Alert, Data Unavailable Alert
Instances: 253
10.4.39.11 Progressive Shift Disable
Monitors if the transmission is reporting that Progressive Shifting is Disabled.
Alert Types: Off Alert, On Alert, Data Unavailable Alert
Instances: 253
10.4.39.12 Progressive Shift Disable
Monitors if the transmission is it has detected a fault..
Alert Types: Off Alert, On Alert, Data Unavailable Alert
Instances: 253
10.4.40 Transmission Warning
Some of the warnings listed under this category in N2KView are duplicates from the Transmission (Twin Disk) category.
10.4.40.1 Check Transmission
Generally indicates some fault condition in the transmission that requires attention. Please consult the transmission manufacturer’s documentation for details.
Alert Types: On Alert, Off Alert, Data Unavailable Alert
Instances: 253
10.4.40.2 Low Oil Level
Generally indicates that the oil level in the transmission has fallen below some transmission-defined limit. Please consult the transmission manufacturer’s documentation for details.
Alert Types: On Alert, Off Alert, Data Unavailable Alert
Instances: 253
10.4.40.3 Low Oil Pressure
Generally indicates that the oil pressure in the transmission has fallen below some transmission-defined limit. Please consult the transmission manufacturer’s documentation for details.
Alert Types: On Alert, Off Alert, Data Unavailable Alert
Instances: 253
10.4.40.4 Over Temperature
Generally indicates that the operating temperature of the transmission exceeds some transmission-defined limit. Please consult the transmission manufacturer’s documentation for details.
Alert Types: On Alert, Off Alert, Data Unavailable Alert
Instances: 253
10.4.40.5 Sail Drive
Generally indicates that the sail driver mode in the transmission has been activated. Please consult the transmission manufacturer’s documentation for details.
Alert Types: On Alert, Off Alert, Data Unavailable Alert
Instances: 253
10.4.41 Vessel
10.4.41.1 Longitudinal Speed, Ground Referenced
Monitors the speed of the vessel in the direction of the bow, relative to ground.
Alert Types: Low Alert, High Alert, Data Unavailable Alert
Instances: 253
10.4.41.2 Longitudinal Speed, Water Referenced
Monitors the speed of the vessel in the direction of the bow, relative to the water.
Alert Types: Low Alert, High Alert, Data Unavailable Alert
Instances: 253
10.4.41.3 Pitch
Monitors the pitch of the vessel (rotation about the horizontal axis perpendicular to the ship’s keel)
Alert Types: High Alert, Data Unavailable Alert
10.4.41.4 Port Trim Tab
Monitors the position of the vessel’s Port Trim Tab
Alert Types: Low Alert, High Alert, Data Unavailable Alert
10.4.41.5 Roll
Monitors the roll of the vessel (rotation about the horizontal axis parallel to the ship’s keel)
Alert Types: High Alert, Data Unavailable Alert
Instances: 253
10.4.41.6 Starboard Trim Tab
Monitors the position of the vessel’s Starboard Trim Tab
Alert Types: Low Alert, High Alert, Data Unavailable Alert
10.4.41.7 Stern Speed, Ground Referenced
Monitors the speed of the stern of the vessel, relative to ground.
Alert Types: Low Alert, High Alert, Data Unavailable Alert
Instances: 253
10.4.41.8 Stern Speed, Water Referenced
Monitors the speed of the stern of the vessel, relative to the water.
Alert Types: Low Alert, High Alert, Data Unavailable Alert
Instances: 253
10.4.41.9 Transverse Speed, Ground Referenced
Monitors the speed of the vessel in the direction perpendicular to the bow, relative to ground.
Alert Types: Low Alert, High Alert, Data Unavailable Alert
Instances: 253
10.4.41.10 Transverse Speed, Water Referenced
Monitors the speed of the vessel in the direction perpendicular to the bow, relative to the water.
Alert Types: Low Alert, High Alert, Data Unavailable Alert
Instances: 253
10.4.42 Vessel Data Recorder
10.4.42.1 Memory Available
Alert Types: Low Alert, Data Unavailable Alert
Instances: 253
10.4.42.2 Memory Used
Alert Types: High Alert, Data Unavailable Alert
Instances: 253
10.4.42.3 Percent Available
Alert Types: Low Alert, Data Unavailable Alert
10.4.42.4 Percent Used
Alert Types: High Alert, Data Unavailable Alert
Instances: 253
10.4.42.5 VDR Status
Alert Types: Not Recording Alert, Data Unavailable Alert
Instances: 253
10.4.43 Watermaker
10.4.43.1 Brine Water Flow
Monitors the flow rate of the Brine Water being returned to the sea.
Alert Types: Low Alert, High Alert, Data Unavailable Alert
Instances: 253
10.4.43.2 Feed Pressure
Monitors the pressure of the water being fed to the Watermaker.
Alert Types: Low Alert, High Alert, Data Unavailable Alert
Instances: 253
10.4.43.3 Post-filter Pressure
Monitors the pressure of the water coming out of the particle filter.
Alert Types: Low Alert, High Alert, Data Unavailable Alert
Instances: 253
10.4.43.4 Pre-filter Pressure
Monitors the pressure of the water going in to the particle filter.
Alert Types: Low Alert, High Alert, Data Unavailable Alert
Instances: 253
10.4.43.5 Product Flow
Monitors the flow rate of the clean product water being produced by the Watermaker.
Alert Types: Low Alert, High Alert, Data Unavailable Alert
Instances: 253
10.4.43.6 Product Water Temperature
Monitors the temperature of the clean product water being produced by the Watermaker.
Alert Types: Low Alert, High Alert, Data Unavailable Alert
Instances: 253
10.4.43.7 Run Time
Monitors the total run time of the Watermaker.
Alert Types: High Alert, Data Unavailable Alert
Instances: 253
10.4.43.8 Salinity
Monitors the salinity level clean product water being produced by the Watermaker.
Alert Types: Low Alert, High Alert, Data Unavailable Alert
Instances: 253
10.4.43.9 System High Pressure
Monitors the pressure of the water going in to the Reverse Osmosis filter.
Alert Types: Low Alert, High Alert, Data Unavailable Alert
Instances: 253
10.4.43.10 Watermaker Operating State
Monitors that the Watermaker Operating State is being reported by the Watermaker.
Alert Types: Data Unavailable Alert
Instances: 253
10.4.44 Wind
There are several different types of wind measurements. They are described in section 9.6.33.
10.4.44.1 Direction / Angle
References: Apparent, Ground, True
Alert Types: Direction Alert, Data Unavailable Alert
Instances: 253
10.4.44.2 Speed
References: Apparent, Ground, True
Alert Types: Low Alert, High Alert, Data Unavailable Alert
References: Apparent, Ground, True
Instances: 253
10.4.45 Xantrex
10.4.45.1 AC Current
Monitors the AC Current being used by the Charger, or produced by the Inverter.
Alert Types: Low Alert, High Alert, Data Unavailable Alert
Instances: 253
10.4.45.2 AC Frequency
Monitors the frequency of the AC Voltage supplying the Charger, or produced by the Inverter.
Alert Types: Low Alert, High Alert, Data Unavailable Alert
Instances: 253
10.4.45.3 AC Power
Monitors the AC Power being used by the Charger, or produced by the Inverter.
Alert Types: Low Alert, High Alert, Data Unavailable Alert
Instances: 253
10.4.45.4 AC Power Factor
Monitors the Power Factor of the AC Power being used by the Charger, or produced by the Inverter.
Alert Types: Low Alert, High Alert, Data Unavailable Alert
Instances: 253
10.4.45.5 AC Reactive Power
Monitors the AC Reactive Power being used by the Charger, or produced by the Inverter.
Alert Types: Low Alert, High Alert, Data Unavailable Alert
Instances: 253
10.4.45.6 AC Voltage
Monitors the AC Voltage supplying the Charger, or produced by the Inverter.
Alert Types: Low Alert, High Alert, Data Unavailable Alert
Instances: 253
10.4.45.7 Converter Low DC Voltage
Monitors the DC Low Voltage Alarm reported by the transmission
Alert Types: Data Unavailable Alert
Instances: 253
10.4.45.8 Converter Operating State
Monitors that the Operating State is being reported by the Converter.
Alert Types: Data Unavailable Alert
Instances: 253
10.4.45.9 Converter Overload
Monitors the Overload status from the Converter.
Alert Types: Off Alert, On Alert, Data Unavailable Alert
Instances: 253
10.4.45.10 Converter Ripple State
Monitors the state of the amount of Ripple Voltage produced by the Converter.
Alert Types: Off Alert, On Alert, Data Unavailable Alert
Instances: 253
10.4.45.11 Converter Temperature State
Monitors the over temperature state reported by the Converter.
Alert Types: Off Alert, On Alert, Data Unavailable Alert
Instances: 253
11 BNWAS (Bridge Navigation Watch Alarm System
From version 4.0.0 N2KView will support a Bridge Navigation Watch Alarm system in compliance with IMO resolution MSC.128/75. Compliance to the functional requirements of MSC.126/75 are as follows:
4.1.1 Compliant. N2KView supports the Automatic Mode through a binary input status. The ship’s track control system must output a signal when it is active and his signal must be fed on to the NMEA 2000 bus via a SIM100 or RIM100. The Manual ON mode may be activated in any of vessel operating modes. This means that the BNWAS System may be activated automatically when the vessel operating mode is Underway.
4.1.2 Compliant. Audible alarm requirement is satisfied by Maretron ALM100 annunciators.
4.1.3 Reset function is satisfied by touching the N2KView screen, clicking a mouse, or pressing a key on the keyboard of N2KView, or by a binary input signal from a switch connected to a SIM100.
4.1.4 Not supported.
11.1 Setting up BNWAS
From the Commands & Settings dialog press the BNWAS button to enter the BNWAS Setup dialog. If the configuration is password protected, then you will need to enter a password to enter this dialog.
At the bottom of the dialog is a diagram showing the stages of operation of the BNWAS on a timeline. As you change the parameters, the values on the timeline will change to reflect what the timings are.
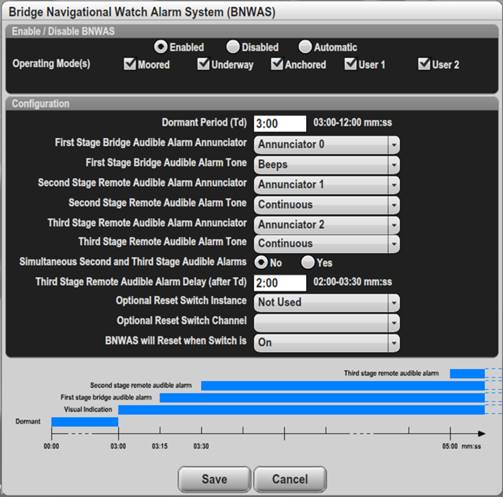
11.1.1 Enabled / Disabled / Automatic Control
The BNWAS system is enabled and disabled by clicking on one of the radio buttons at the top of the dialog.
Enabled – When the Enabled radio button is selected, the BNWAS will be operational if the Vessel Operating Mode matches an operating mode in the dialog that is checked.

Disabled – The BNWAS is disabled

Automatic – The BNWAS is enabled when the binary condition specified by the Controlling Switch is TRUE.

11.1.2 Dormant Period (Td)
The dormant period is the period during which the BNWAS is operational and waiting to detect inactivity on the bridge. Any key press, mouse click, or touch on the N2KView screen will reset the BNWAS to the start of the dormant period.
The dormant period may be set anywhere from 3 to 12 minutes.
11.1.3 Visual Indication Stage
If there is no input to N2KView for the entire dormant period, the BNWAS will enter the Visual Indication stage. In the visual indication stage a yellow warning will show at the bottom of the N2KView screen.
The visual indication stage will last 15 seconds. Any key press, mouse click, or touch on the N2KView screen during the visual indication stage will reset the BNWAS to the start of the dormant period and the yellow warning will be removed.
11.1.4 First Stage Bridge Audible Alarm
If there is no input to N2KView during the visual indication stage, the BNWAS will enter the First Stage Bridge Audible Alarm. The yellow warning is changed to a red Alarm at the bottom of the screen, and an ALM100 annunciator on the bridge will alert the watchkeeper.
The instance number of the ALM100 on the bridge, and the required tone are configured in the First Stage Bridge Audible Alarm Annunciator and First Stage Bridge Audible Alarm Tone fields in the dialog.
The First Stage Bridge Audible Alarm stage will last 15 seconds.
11.1.5 Second Stage Remote Audible Alarm
If there is no input to N2KView during the First Stage Bridge Audible Alarm, the BNWAS will enter the Second Stage Remote Audible Alarm. A second ALM100 annunciator elsewhere on the vessel will sound to summon another person to the bridge.
The instance number of the second ALM100 and the required tone are configured in the Second Stage Remote Audible Alarm Annunciator and Second Stage Remote Audible Alarm Tone fields in the dialog.
11.1.6 Third Stage Remote Audible Alarm
If there is no input to N2KView during the Second Stage Bridge Audible Alarm, the BNWAS will enter the Third Stage Remote Audible Alarm. A third ALM100 annunciator elsewhere on the vessel will sound to summon yet another person to the bridge.
The instance number of the third ALM100 and the required tone are configured in the Third stage Remote Audible Alarm Annunciator and Third Stage Remote Audible Alarm Tone fields in the dialog.
The period from the expiry of the Dormant period to the activation of the Third Stage Remote Audible Alarm may be configured in the dialog anywhere from 2 to 3 ½ minutes. Alternatively, it may be set to sound the 3rd annunciator simultaneously with the second by selecting the Yes radio button as shown below.
11.1.7 Optional Reset Switch Instance
Optionally, the BNWAS may be reset by a switch connected to a SIM100, or a similar device that satisfies the requirements of the IMO. If this option is not used the Instance value should be set to Not Used.
11.1.8 Optional Reset Switch Channel
If the option to reset the BNWAS by a switch is used, this field specifies the channel number of the switch.
11.1.9 BNWAS will Reset when the Switch is
If the option to reset the BNWAS by a switch is used, this field specifies if the BNWAS must reset if the switch is ON or the switch is OFF.
12 Load Shedding
AC Power is a limited resource on a boat, even more so when connected to a shore supply with limited current. Load shedding enables the automated switching off of predetermined circuits such as water heaters and battery chargers when the load drawn from the supply exceeds a specified current. This extra capacity then enables the use of other loads that require immediate use, such as hair driers.
From version 4.5, N2KView will be equipped with two groups of Load Shedding, to satisfy the needs of owners with two independent power systems.
Load Shedding requires the optional Control Module to be licensed. (this is included with all version 4 licenses)
12.1 Sources
Each N2KView Load Shedding group is designed to monitor 4 power sources simultaneously, typically two generators and two shore supplies. The Load Shed current is set up individually for each power source, and the Load Shedding software will try to ensure that the current drawn from each of these sources does not exceed the current set. Exceeding the current of a Utility (Shore Supply) will typically trip a breaker, while exceeding the capability of a generator may damage the generator.
Sources may be Single Phase, Split-Phase, or Three Phase.
Each Source requires a Maretron ACM100 to be connected to report the current supplied by that source.
For best performance, the ACM100 should be configured as follows, in the advanced configuration page -
· Damping Period – V, I, F : 100 ms
· NMEA 2000 PGN Enable/Disable – Phase A, B, C, and Average Basic Quantities 500ms
12.2 Loads
N2KView Load Shedding can switch up to 10 loads. Typically the only loads that one chooses to switch off are water heaters, driers, air conditioners, and battery chargers, so the limit of 10 loads should not be a limit on most systems.
Due to the variety of links between the sources and the loads, N2KView may switch off loads that are not connected to the overloaded source. This is the safest way to ensure that all the sources are protected under all conditions, without reprogramming the system each time the Power Distribution is changed.
The estimated Current Draw for each load must be programmed into N2KView in the Load Shedding Dialog.
Only Loads controlled by the Carling Octoplex AC box, Carling Octoplex DC Controller, Maretron’s MPower DC Controllers or DCR100 are candidates for load shedding. The DC Controllers and DCR100 would need to switch an AC load indirectly through a relay.
12.3 Startup
On startup, Load Shedding will always be disabled. To enable Load Shedding, open the Commands & Settings Tab, and then press the Load Shedding button. Click on the Load Shedding Enabled box and press Apply or Save.
12.4 Shedding Loads
If enabled, N2KView will start shedding loads (switching off the breakers) in order when the current reported by any of the sources meet or exceed the Load Shedding Current configured by the user for that source. The current is averaged over the Delay Between Sheds period specified in the Load Shedding Dialog.
In the case of a multi-phase source, the current reported will be the average of the maximum currents reported by each phase. If individual phase currents are not reported, then the average phase current will be used.
Breakers that are Locked will not be considered for Load Shedding.
Sources that do not report current will not be protected for Load Shedding.
Sources that do have a Load Shedding Current, or whose Load Shedding Current has been set to zero will not be considered for Load Shedding. This is the way to indicate to N2KView that a source is not being used.
12.5 Restoring Loads
If enabled, shed loads will be restored in reverse order when N2KView calculates that adding the load back will not cause the current for each source to rise above 90% of the Load Shedding Current for that source. The assumption that the current drawn by the load to be restored may increase the current required by any of the sources by that amount ensures that none of the sources may be overloaded.
Breakers that are Locked will not be considered for restoring.
Only breakers that have been turned off previously by N2KView because of Load Shedding will be considered for restoration. The Breaker Status reported in the Load Shedding Dialog will be “Load Shed”.
If any source has a Load Shedding Current programmed (i.e. the source is known be in use), and the current reported by that source is not available (displayed as a dash) NO loads will be restored.
When load shedding is disabled, all loads that have been shed will be restored.
12.6 Configuration
Configuration of Load Shedding is done in the AC Load Shedding dialog; this is accessed through either the AC Load Shedding 1 button or the AC Load Shedding 2 button in the Power Management sub-menu, depending on which Load Shedding group you wish to configure.
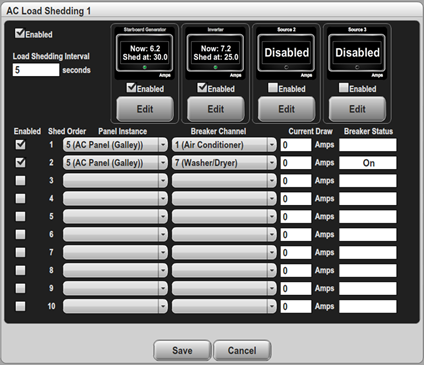
Figure 148 – AC Load Shedding Dialog
12.6.1 General
Each Load Shedding Group is enabled / disabled using the Enabled check box at the top left.
The Load Shedding Interval determines how often the Load Shedding Algorithm runs. If this figure is too small, then the result of making a shed will not have enough time to be measured by the ACM100 and reported back, and additional loads will be shed unnecessarily. The system will become too responsive.
The currents reported by the Sources will be averaged over this period.
NOTE: Changes in the Load Shedding Dialog do NOT take effect until either the Apply or Save button is pressed. Save will apply the changes and exit the dialog. Cancel will exit the dialog without making any changes.
12.6.2 Configuring Sources
The top portion of the screen shows the Sources being monitored. The Sources are labeled “Source 0”, “Source 1”, “Source 2”, and “Source 3”. If the Source has been set to an ACM100, and the ACM100 supplies a label, the label on the control will be changed to that supplied by the ACM100.
The Digital Control shows both the current reported by the ACM100, and the Load Shedding Current. A dash for the Load Shedding Current implies that the source is not providing a current that can be monitored for load shedding. If the user disables the source, it will show Disabled.
The LED on the Digital Control will show red when the reported current exceeds the Load Shedding Current, yellow when the reported current is within 10% of the Load Shedding Current and green when less than 90%.
The Source is configured my pressing the Edit Button, and may be enabled / disabled from this dialog.
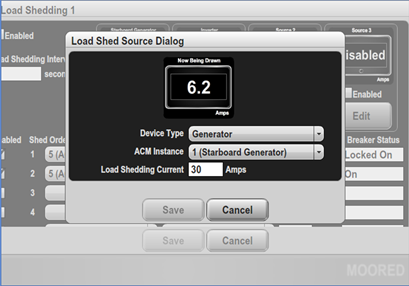
Figure 149 – Load Shed Source Dialog
The Digital Control shows the current reported by the ACM100.
The user can set the parameters to choose the correct ACM100 (Device Type and ACM instance number) and the current at which Load Shedding will take place.
12.6.3 Configuring Loads

These are edited on the AC Load Shedding dialog.
Individual Loads may be configured to be included or excluded from the Load Shedding by checking the Enabled box.
The Panel Instance and Breaker Channel are set by the user to identify which breaker is to be switched to shed the load.
The Current Drawn is set by the user to inform the algorithm how much current will be shed or restored by switching this load.
The Breaker Status is reported by the system in real time so that the user can see the current state of the breaker. Values are “Off”, “On”, “Locked Off”, “Locked On”, “Load Shed”, “Tripped” and “Unknown”
13 Anchoring with N2KView
This section is an introduction to the new Anchoring features of N2KView. New, extensive support for monitoring Anchoring have been added to N2KView in version 6.0.12. Monitoring is supported for
· The Anchoring process, including dropping and setting the anchor
· Anchor Drag after the anchor is set
· Retrieving the anchor
13.1 Glossary of Terms used in Anchoring
Before we get started, let’s define the terms used in this section.
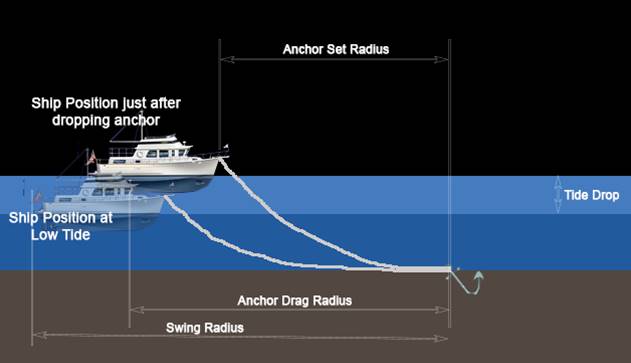
1. Anchor Drag Radius – The maximum distance possible between the boat’s position (at the GPS) and the position of the anchor. If the Rode is not changed the boat can go further from the anchor at low tide, so this is calculated at low tide. If the actual distance from the position where the anchor was dropped to the GPS is ever greater than the Drag Radius, then the anchor is not holding, and you are dragging your anchor. The Drag Radius is the distance entered in the Anchor Watch Alert.
2. Anchor Set Radius. This is the maximum distance between the anchor position and the hawsepipe, considering the rode deployed, the height of the hawsepipe, and the depth of the anchor. It is only applicable at the time of anchoring and does not account for tide changes. It is used when checking if the anchor has set. N2KView will stop displaying the Set Radius an hour after the anchor is dropped.
3. Minimum Required Anchor Scope. Depending on the Anchor type and bottom, this is the minimum ratio of Rode deployed to depth of water that is required for the anchor to hold. The value is entered by the user before approaching the area and the software used it to determine the Suggested Rode.
4. Scope. This is the ratio of Rode deployed to the depth of the water. The choice of scope depends on the anchor type and condition of the seabed.
5. Swing Radius. This is the radius of the circle, centered on the anchor position, in which any part of the boat can go. If any obstruction is inside the swing circle, either the rode needs to be reduced or the anchor position moved.
6. Tide Drop. This is the maximum amount that the tide is expected to drop from the time the anchor is dropped during the period that the vessel will be at anchor. This may be over more than one tide cycle.
7. Tide Rise. This is the maximum amount that the tide is expected to rise from the time the anchor is dropped during the period that the vessel will be at anchor. This may be over more than one tide cycle.
8. Hawsepipe. This term is loosely used to identify where the anchor chain is attached to the vessel, or the position the boat from where the anchor is dropped. For most vessels it will be at the bow. When dropping the anchor, the distance from the GPS to the point where the anchor is dropped is critical to determine the anchor drop position, and the distance from the bow to the anchor drop position will determine the correct positioning of the symbol on the Anchor component. The height of the hawsepipe allows N2KView to calculate the vertical component of the rode from the hawsepipe to the sea bed.
13.2 How is N2KView going to help you anchor
a. N2KView will allow you to enter and adjust the tide rise and fall and required Minimum Required Anchor Scope. These values will be used in subsequent calculations.
b. While approaching your anchoring position it will monitor the depth of water and calculate and display the amount of Rode (Suggested Anchor Rode) required to achieve your required Minimum Anchor Scope at high tide. It will also calculate and display the Drag Radius and Swing Radius for that rode and depth.
c. While approaching your anchor position, it will monitor the depth of water and indicate if the tide drop will result in your boat grounding.
d. When the anchor is dropped, N2KView will record the anchor position, time of drop and the depth when the anchor is dropped.
e. N2KView will allow you to enter and adjust the rode deployed so that all calculations made after the anchor is dropped use the correct rode.
f. While checking that your anchor is set and holding, N2KView will display a circle centered on the anchor position with a radius equal to the maximum distance between the hawsepipe and the anchor. This is the Set Radius. N2KView will also display the distance that you are over the Set Radius (it should always be negative).
g. N2KView will continuously calculate and display the distance from the anchor to your GPS, and the distance from the anchor to the hawsepipe. On Master Anchor controller the position of your vessel will be recorded every minute as displayed and ‘bread crumbs’ on the Anchoring Control.
h. If your anchor drags while you are setting, N2KView will calculate the new anchor position when the anchor does set.
i. While at anchor N2KView will monitor the boat’s position and generate an alert if the boat goes outside the Drag Radius.
j. While pulling up the anchor, N2KView will provide continuous range and bearing information which can be used to steer the boat until the hawsepipe is directly above the anchor position.
13.3 Configuring N2KView Anchoring.
For N2KView to correctly understand your anchoring setup, there are a few physical dimensions that we need to set up. Go to the Configuration Menu and press on Anchoring to display the Anchoring Configuration Dialog. This will only need to be done once.
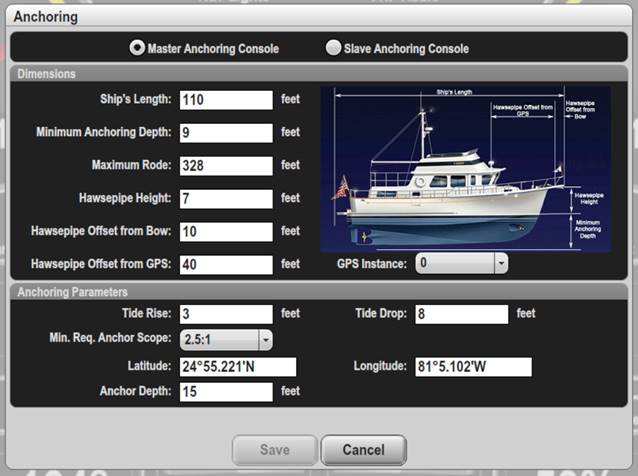
For now, we will only enter the dimensions of your vessel.
Ship’s length – this is the overall length from the front of the pulpit to the back of the swim platform.
Minimum Anchoring depth – The minimum depth of water you are comfortable anchoring in. Typically this will be your draught plus some safety margin.
Maximum Rode – this is the maximum rode that can be deployed.
Hawsepipe Height – The height of the Hawsepipe above the waterline. If you are using a bow eye, then enter the height of the bow eye.
Hawsepipe Offset from Bow – this is the distance from the front of the pulpit longitudinally to the point where the anchor is dropped.
Hawsepipe Offset from GPS – this is the distance from the GPS longitudinally to the point where the anchor is dropped at the hawsepipe.
GPS Instance – The instance number of the GPS to be used to monitor the Anchoring. This must correspond with the Hawsepipe Offset from GPS.
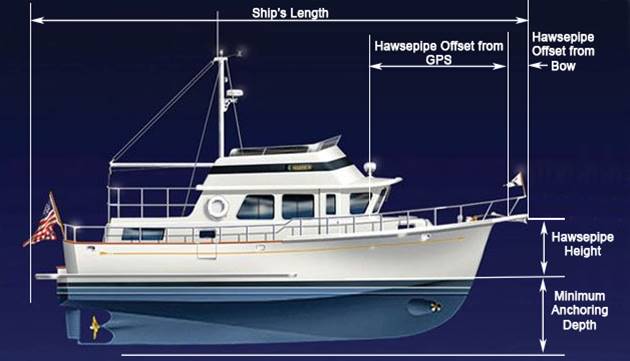
Master Anchoring Console – only one terminal should be designated as the Master Anchoring Console. Slave terminals will repeat the information calculated by the Master console, and any command given at Slave terminals will be sent to the Master for action.

13.4 Getting Ready to Anchor
The following screenshot shows the components that are used when approaching the anchor position.
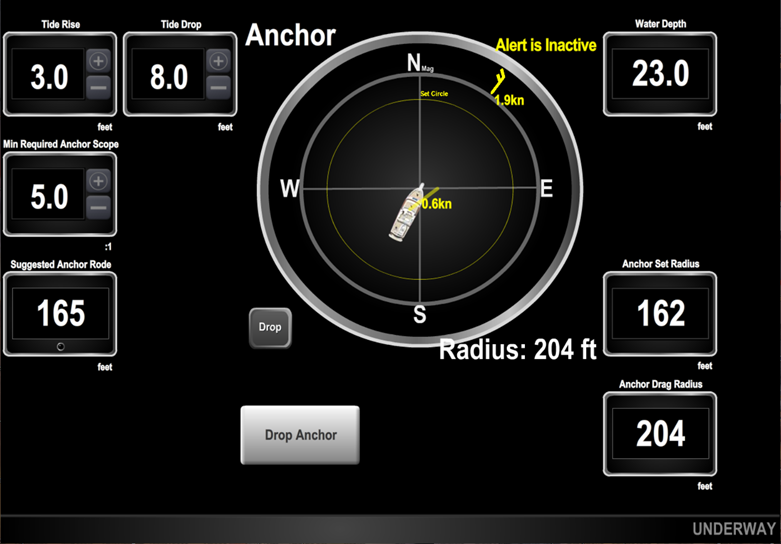
Use the Tide Rise, Tide Drop, and Minimum Required Anchor Scope components to enter and modify the parameters that relate to this anchorage.
Based on these parameters and the Water Depth as measured by the depth sounder, N2KView will continuously calculate and display the Minimum Anchor Rode required to achieve the Minimum Required Anchor Scope at High Tide. For this value of Rode, N2KView will also calculate and display the resultant Anchor Set Radius and Anchor Drag Radius. The Anchor Set Radius is the maximum distance from the anchor to the hawsepipe at the time and tide of dropping the anchor.
The center component is the graphical Anchor component. It is a complex component which always has as its center the position at which the anchor was dropped. The boat is drawn to scale relative to the radius and is oriented according to its heading. On top of the boat a small vector shows the course and speed from the GPS, and another vector outside the circle show the Wind Speed and Direction. The yellow circle shows the Anchor Set Radius for the Minimum Anchor Rode, and the solid white circle shows the Anchor Drag Radius for the Minimum Anchor Rode.
N2KView also monitors the water depth reported by the depth sounder, checking if the tide drop will leave you grounded. In the next screenshot, the water depth has dropped to 13’. With an expected Tide Drop of 8’ and a safe anchoring depth of only 6’, the boat will be grounded at low tide – so the background of the Tide Drop component has been colored red.
Note: This is just an aid to help you. If the bottom is all not at the same depth within the Swing Circle, you still have the responsibility to ensure that there is enough water at low tide not to ground the boat anywhere within the swing circle.
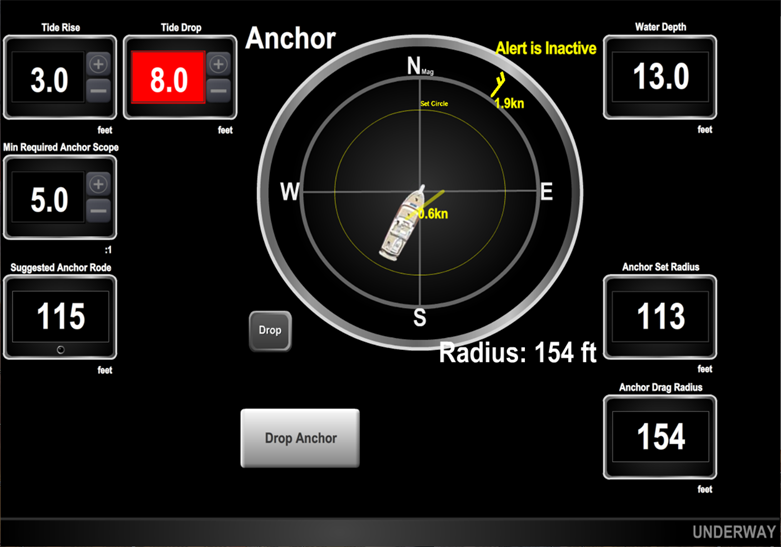
13.5 Dropping the Anchor
When you are over the position at which you want to drop your anchor, press the Drop Anchor button. N2KView will record the position at which the anchor is dropped, the time and date, and the depth of water at that point, which will become the anchor depth.
We now introduce some more components.
Alongside the Suggested Anchor Rode is the Anchor Rode component. Although it is set to the Suggested Anchor Rode when the Drop Anchor button is pressed, the user is required to correct this value manually after the rode has been deployed. The Drag Radius and Swing Radius must use the actual rode deployed and this is where that figure is input to the system.
From the actual Anchor Rode, N2KView will calculate the Actual Anchor Scope at high tide. This is the worst that the Scope will be as the boat moves up and down with the tide. N2KView also starts displaying the Distance that the boat is beyond the Set Radius and the Distance beyond the Drag radius. While you are inside the circle, these values will be negative – if they go positive you will get an idea of just how much you are dragging your anchor.
And we show the distance from the anchor to the GPS and to the hawsepipe.
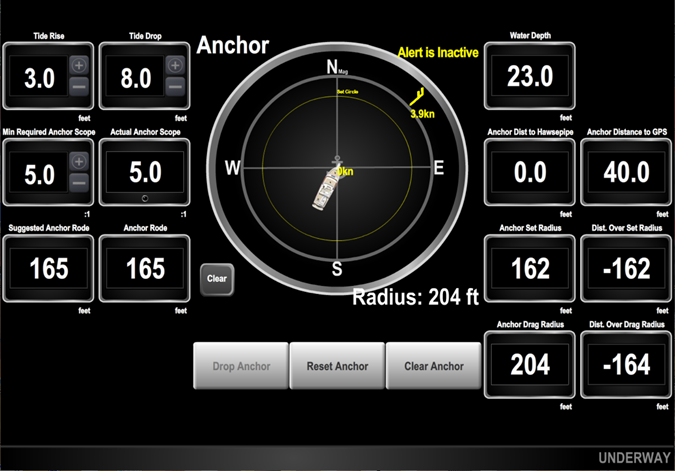
Having pressed the Drop Anchor button, start deploying the anchor and when it hits the seabed, start backing down.
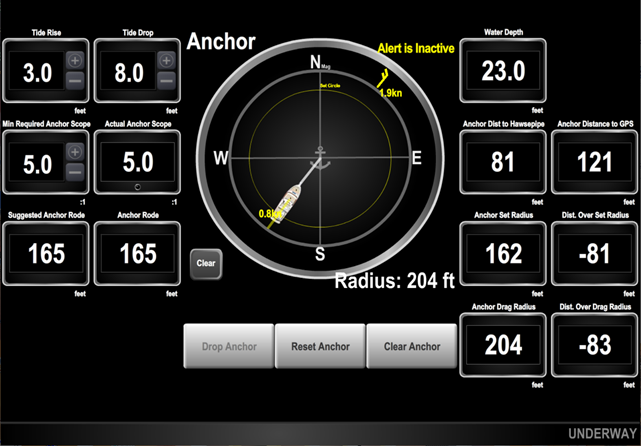
You can see the vector behind the boat showing that we are backing down. You can also see that we have 81 feet to go before reaching the Set Radius. This is an important number. Without N2KView’s anchoring calculations you do not know when to expect the boat to reach the end of its rode so that you check if it has set correctly. There will be several times that the rode will snag, and it will feel like you are at the end of the rode, but the boat will break free. With N2KView a perfect set will happen when the hawsepipe on the diagram is almost at the yellow line.
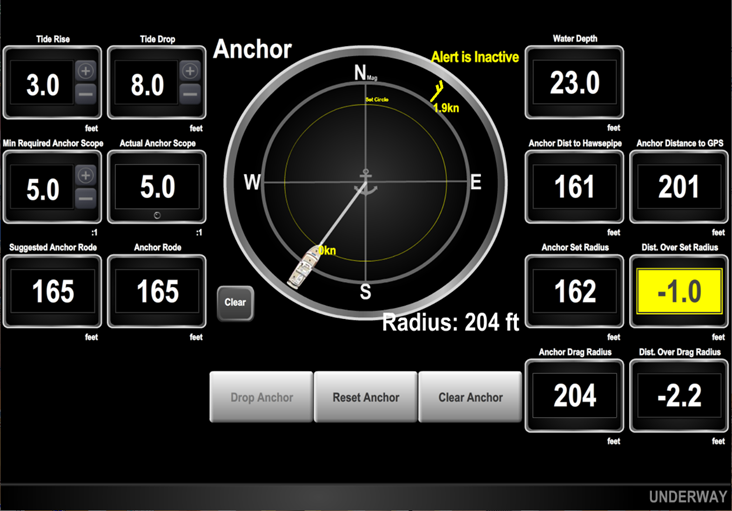
You can set the colors on the Dist. Over Set Radius component to warn you when you are close to the radius.
If the boat holds on the anchor, you are almost done. Switch off the engines and change the Vessel Operating Mode over to Anchored and the Anchor Watch Alert becomes Active with the correct position and radius.
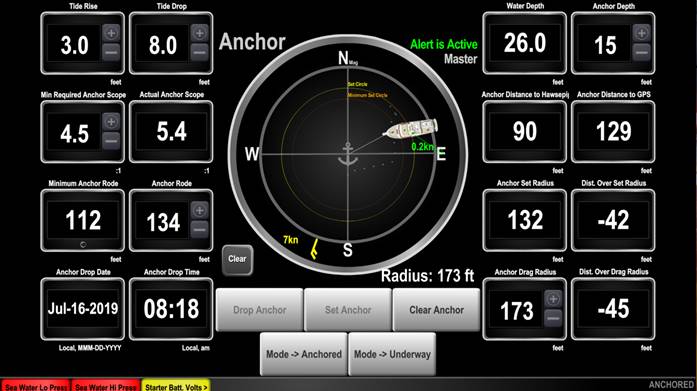
While drifting at anchor, the Anchor component will show you your boat’s position relative to the anchor, the wind, and the movement of the boat. You can also see the Anchor Depth at the time that the anchor was dropped, and the Time and Date. You can add buttons to the screen to later change the mode back to underway. The breadcrumbs show where the boat has been over the previous 12 hours. Each point can be clicked with the mouse to show the time and measured depth at that point. The point will be tinted red if there is less than 6 feet of water under the Minimum Anchoring Depth.
There are also components to display the Anchor Lat/Long, and the Vessel Swing Circle Radius, not shown on the screen.
In the above diagram, the calculated Minimum Anchor Rode is 112 ft. The orange circle on the Anchor component shows the Set Radius corresponding to this minimum value. The Actual Rode (this value is set by the user to correspond with the amount of rode that has been deployed) has been set to a larger value, 134 feet, and the yellow Set Circle on the display corresponds to this value.
The Anchor Set Radius is only valid for a short time after the anchor is dropped, due to the changing tides. For this reason, N2KView will stop showing the Minimum Set Radius and the Set Radius after one hour.
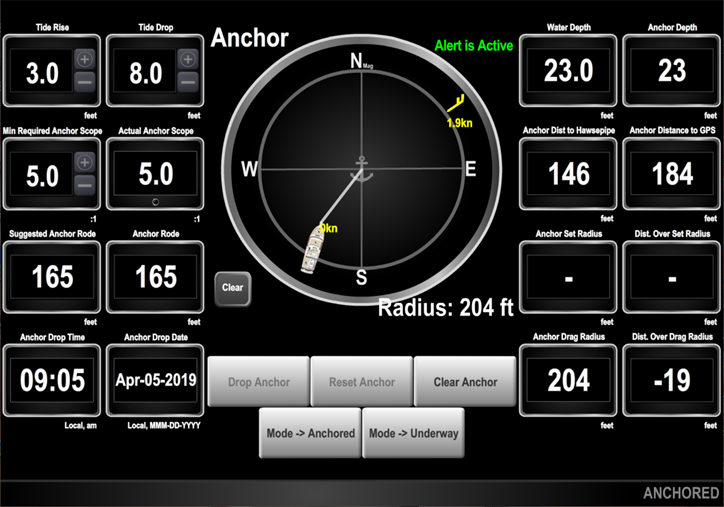
13.6 Retrieving the anchor
To retrieve the anchor, look at the Anchor control to guide you to the anchor position. This is much easier than having someone on the bow looking at the rode and signaling left and right so that you can follow the chain. No more guessing where you dropped your anchor.
The Anchor Distance to Hawsepipe component will tell you how far you are away from the anchor, so you can bring the bow right up to the center of the Anchor component and then you will be raising the anchor vertically to break its hold on the sea bed.
When the anchor is raised, press the Clear Anchor button and change the Vessel Operating Mode to Underway.
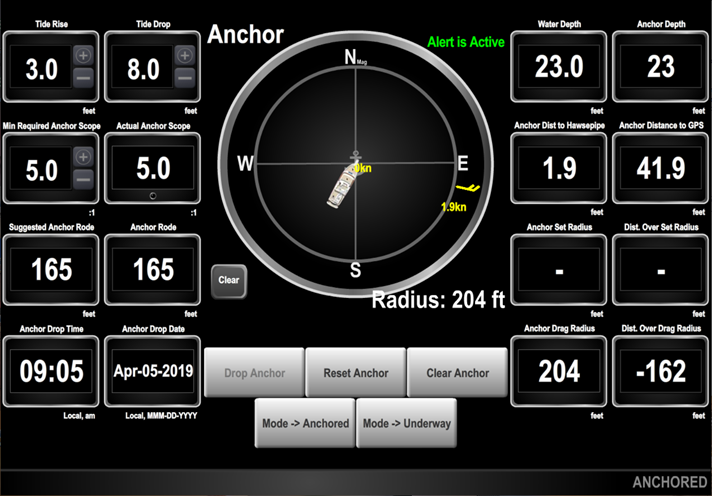
13.7 Dragging you anchor while Setting
If you drag your anchor while setting, the symbol on the Anchoring component will be outside the Drag Radius and the Anchor and Drag circle will turn red.
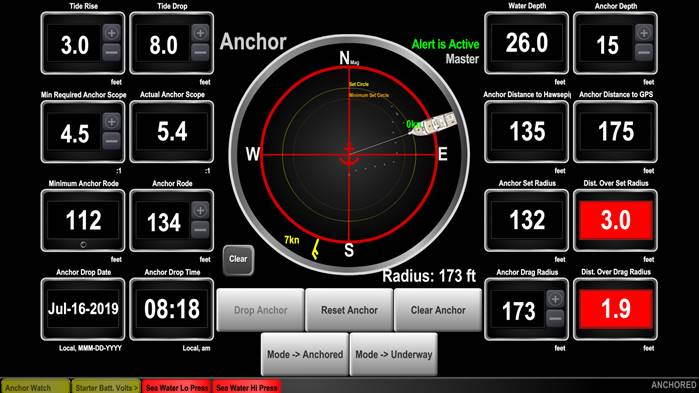
If the anchor sets while you are pulling back, the boat will stop. The anchor is no longer at the original drop point, so we need to reset the anchor to its new position.
Make sure that the rode is directly ahead of the vessel and press the Reset Anchor button while you are pulling back and there is tension on the anchor. N2KView will re-calculate the position of the anchor and update the database.
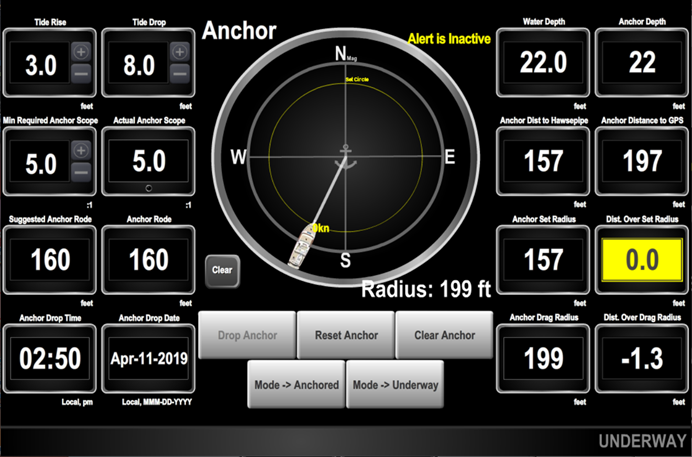
The Anchor Depth, Anchor Drop Time and Anchor Drop Date have not changed, but the position of the anchor has changed so that the Set Radius now matches the Rode and the Distance Over Set Radius is 0.0.
Press the Mode à Anchored button to change the Vessel Operating Mode to Anchored.
14 Video and Cameras
N2KView version 2.5 introduces a video component that may be used to monitor cameras connected to the N2KView computer using the ship’s Ethernet network. The NMEA 2000 bus is not used to transfer the camera video streams or to control the cameras.
Video Monitoring requires the optional Video Module to be licensed. (only applicable to older licenses)
Having the video display embedded within N2KView has the advantage that the user can see the video and the gauges simultaneously, and all the N2KView Alert monitoring is active, with the active alerts always visible at the bottom of the screen.
14.1 Suitable Cameras
14.1.1 Axis Cameras
The following Axis IP cameras have been tested with N2KView.
· AXIS 212 PTZ
· AXIS 215 PTZ
· AXIS P3301
· AXIS Q7401
· AXIS M3113 PTZ
· AXIS M3114 PTZ
· AXIS P3343 PTZ
· AXIS M5525 PTZ
Any other AXIS camera supporting the VAPIX™ protocol may also be used, but N2KView will not be able to populate the supported screen resolutions. You will be required to determine the correct resolution and input it.
In addition, analog cameras may be connected to an Axis video server, which is then connected to the N2KView computer using Ethernet.
· AXIS 241S: This is a Single Channel Encoder (Used to convert analog camera (NTSC, PAL) to Internet Protocol (IP))
· AXIS 240Q: This is a Four Channel Encoder.
· AXIS 241Q: This is a Four Channel Encoder.
14.1.2 Hatteland Cameras
The Hatteland SeaHawk range of cameras has been tested with N2KView.
14.2 Camera Setup
Before the cameras can be accessed from the Screen Setup, they must be entered into N2KView in the Camera Setup Screen. This screen is entered by selecting the Cameras Setup tab on the Commands & Settings Dialog.
The Camera Setup dialog contains a list of cameras that the user has created to cover all the cameras on the boat. Note that one physical camera may be represented by more than one camera in this list, possibly with different resolutions or frame rates.
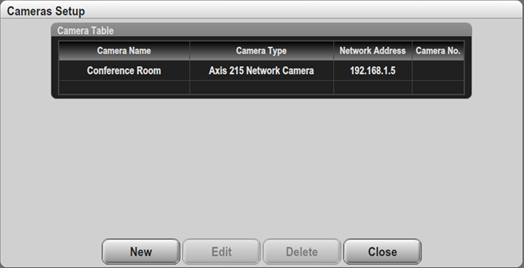
Figure 150 – Camera Setup Dialog
The Camera Editor is entered either be pressing “New” or by selecting an existing camera from the list in the Cameras Setup Screen and pressing “Edit”. Once in the Camera Editor dialog, select the type of camera from the Type Drop Down List.
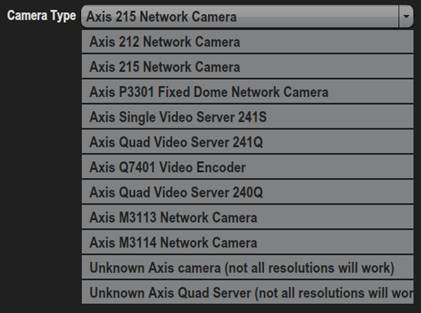
Figure 151 – Camera Type Drop Down List
Scroll up and down to see all the choices.
14.2.1 Camera Editor
The Camera Editor allow all the video parameters to be set in one place, and then just referenced from the screens in which they are displayed.
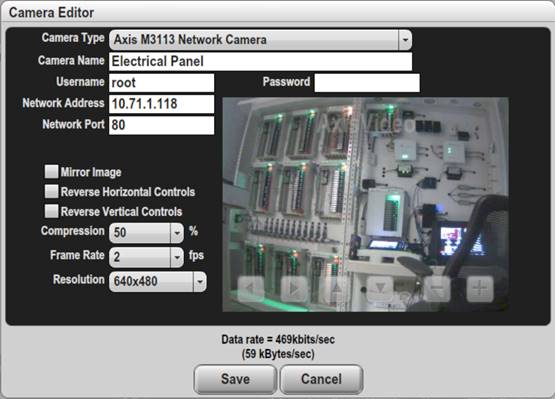
Figure 152 – Camera Editor Example with Axis M3113 Camera
14.2.1.1 Camera Type
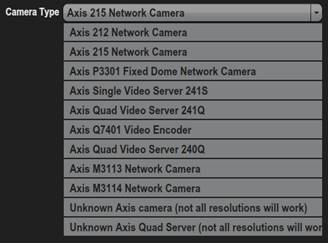
Different cameras from Axis will have different Resolutions. Choosing the correct camera from the list will enable N2KView to correctly populate the Resolution field in this editor.
Choosing the Unknown Axis Camera or Unknown Axis Quad Server will populate the list of resolutions with all the known resolutions that Axis supports. Not all of these resolutions will be supported by the actual camera that you have installed, and you must select a valid resolution for that camera. See the documentation that comes with the camera for a list of supported values.
14.2.1.2 Camera Name
This is the name by which you will identify the camera when creating a video component.
14.2.1.3 Username
Axis cameras allow anonymous logins to display video. If the camera is set up not to use anonymous logins, accessing the video will require a username. Enter the username required by the camera in this field.
14.2.1.4 Password
If the camera requires a password to access the video feed, this is the field where the password in entered. If there is a password already entered in N2KView, this field will display a blank – there is no reason to enter a new password if it is not going to change.
14.2.1.5 Network Address
This is the IP Address of the camera on the local boat network. If your network includes a DNS server, this may be entered as a name.
14.2.1.6 Network Port
This is the port number on the camera that allows us to access the video stream. Port 80 is the normal default.
14.2.1.7 Camera No.
When setting up an analog camera attached to the quad video server, the camera number in the server is chosen from a drop down list.
When the Unknown Axis server is selected, the no of camera choices is increased to 16. If a camera contains multiple View Areas, the desired View Area is chosen as a camera number.
14.2.1.8 Mirror Image
The image will be flipped to produce a mirror image if this box is checked.
14.2.1.9 Reverse Horizontal Controls
If the Camera includes PTZ controls, this allows the Pan function to be reversed.
14.2.1.10 Reverse Vertical Controls
If the Camera includes PTZ controls, this allows the Tilt function to be reversed.
14.2.1.11 Compression, Frame Rate, and Resolution
There is a tradeoff between the quality of the picture displayed and the bandwidth or data rate required to support that quality. On the local network of the boat this is probably not important, but when transmitting the picture over the internet you may wish to compromise the quality to save bandwidth.
Compression is the amount of pre-processing that can be done to each image before transmitting to squash the image into a smaller size. Compression values less than about 80% produce very little distortion in the image and can result in significant savings in bandwidth It does require more processing power to do the compression and then decompress in N2KView.
Frame Rate is the number of frames that are transmitted every second. The higher the frame rate, the smoother the video. Doubling the frame rate requires twice the bandwidth.
Resolution is the amount of pixels (or dots) that make up the picture. The first number is the number of dots across the screen, the second is the number from top to bottom. The larger the resolution, the more detail can be seen in the picture and the greater the bandwidth requirement. For the Unknown Axis Camera and the Unknown Axis Server, the drop down of resolutions has been replaced by a text field where you can enter any resolution supported by the camera. The field may also be left blank, in which case a resolution will not be requested from the camera, and the camera will supply the default resolution.
14.2.1.12 Data Rate
Rather than try to calculate the bandwidth or data rate required to support the camera at the requested Compression, Resolution, and Frame Rate, the Camera Editor will try to connect to the camera and the requested values and display the video and the data rate. This will help you decide the balance between quality and cost in real time.
15 Send data to the Telemetric Cloud Service
In version 5.1.0, Maretron introduced Telemetric Cloud Service for the MBB200C, MBB300C, TSM800C, TSM810C, and TSM1330C.
If you have an Internet connection on your vessel, you can select a set of parameters on N2KView, and N2KView will transmit those parameters to the Cloud Service at a rate that you select. Once on the Cloud Service, they will be stored for up to a year, which they may be accessed from N2KExtractor for data analytic purposes or from a web page for a quick glance at some recent data. The Cloud Service also offers a geo-fence monitor.
15.1 Two Cloud Services
Maretron has two Cloud Service offerings. They are very distinct and have completely different applications, so it’s worth distinguishing clearly between them.
15.1.1 Maretron Real Time Cloud Service
This allows N2KView to remotely log on to the vessel and display all the data from the vessel in real time. No data is stored in the cloud. All the PGNs from the vessel are transmitted in real time, allowing a remote user the same experience as if they were on the boat.
This data can be monitored by the remote N2KView to generate alerts and populate controls on the screen.
This feature requires the vessel to be equipped with a IPG100 Internet Protocol Gateway.
15.1.2 Maretron Telemetric Cloud Service
This allows N2KView on the vessel to push a selected set of processed data to the cloud, where it is stored. This data is not transmitted in real-time. The frequency of the data transmission and choice of data to send to the cloud is made in N2KView on the vessel, resulting in an extremely low and predictable data usage to the cloud.
If the connection to the Telemetric Cloud Service is broken, N2KView will store the messages and then upload them when the connection is restored.
This feature is only available on the MBB200C, MBB300C, TSM800C, TSM810C, and TSM1330C.
15.2 Telemetric Cloud Service Dialog
A new button has been added to the Commands & Settings Dialog named Telemetrics. This is only available on a MBB200C, MBB300C, TSM800C, TSM810C, and TSM1330C.
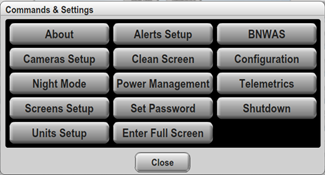
Pressing the Telemetrics button will open the Telemetric Cloud Service dialog.
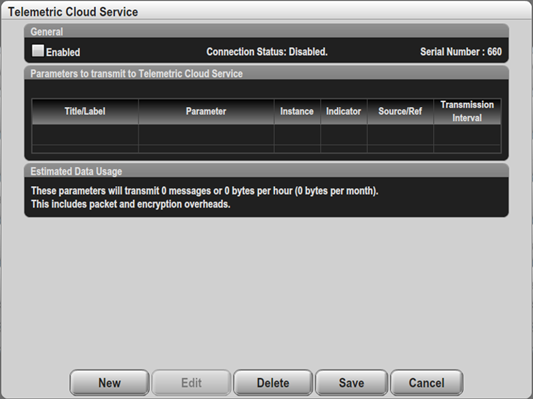
The dialog is divided into three sections.
15.2.1 General
In the general section, you can enable and disable the connection to the cloud service, see the status of the connection, and get the serial number used to identify the vessel to the cloud.
15.2.1.1 Enabled checkbox
Checking the Enabled checkbox will attempt to immediately connect the vessel to the Cloud Service. If a connection is not made, N2KView will periodically retry to make the connection, and when it does, any un-transmitted data will be uploaded.
Unchecking the Enabled checkbox will immediately disconnect the vessel to the Cloud Service. While checkbox is unchecked, no data will be transmitted or saved for later transmission.
15.2.1.2 Connection Status
The status of the connection will be displayed in the center.
15.2.1.3 Serial Number
When creating an account on the Maretron Telemetric Cloud Service for the vessel, you will identify the vessel by the serial number shown here.
15.2.2 Selecting Parameters to be Transmitted
The central portion of the dialog contains a table of parameters that have been selected to be transmitted to the Telemetric Cloud Server.
15.2.2.1 New
Pressing the New button allows selection of a new Parameter to be added to the table.
You will be presented with a list of parameters that support this functionality.
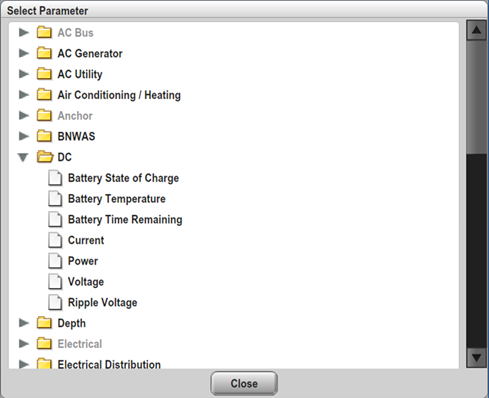
Select the parameter that you would like to add to the table by clicking on it, and the Telemetric Cloud Service Parameter Editor dialog will be opened (see section 0).
15.2.2.2 Edit
To edit a parameter already in the table, click on the line in the table containing that parameter, and then click the Edit button. The Telemetric Cloud Service Parameter Editor dialog will be opened (see section 0).
15.2.2.3 Delete
To stop a parameter transmitting data to the Telemetric Cloud Service, remove it from the table by selecting it in the table and then pressing the Delete button.
15.2.2.4 Save
To save the changes made in the table, press the Save button.
The state of the connection is directly controlled by checking and unchecking the Enabled check box. Pressing the Save button will not make a connection to the Cloud, or disconnect from the Cloud.
15.2.2.5 Cancel
To exit from this dialog without applying the changes made in the table, press the Cancel button.
The state of the connection is directly controlled by checking and unchecking the Enabled check box. Pressing the Cancel button will not make a connection to the Cloud, or disconnect from the Cloud.
15.2.3 Estimated Data Usage
Because uploading parameter data to the Maretron Telemetric Cloud server frequently can be done from areas where bandwidth can be expensive, Maretron has made this process as efficient as possible with very small message sizes. N2KView will also calculate the expected total data usage for all the parameters and display it here.
Status parameters that are marked with a * will be transmitted on change as well as at the period requested. While this will reduce overall bandwidth by allowing a very long interval between transmissions without losing any critical information, it will mean that the estimated data usage will be more than that estimated.
The estimated data usage shown includes an estimate for overhead added for data encryption and transmission.
15.2.4 Maximum amount of data that can be transmitted
The overall maximum amount of data that can be transmitted is limited to 6000 messages per hour. If you select every parameter to have a transmission interval of 1 minute, you will be limited to 100 parameters, and a message will be displayed at the bottom of the dialog to this effect.
15.3 Telemetric Cloud Service Parameter Editor
The Telemetric Cloud Service Parameter Edit dialog is where you enter the details about the parameter that you want to upload, (e.g. the instance number) and the transmission interval. To validate that the parameters refer to data that is on the bus, a small digital control will show you the current value that would be transmitted. If the control shows a dash ( “-“ ) then you may have the instance number wrong.
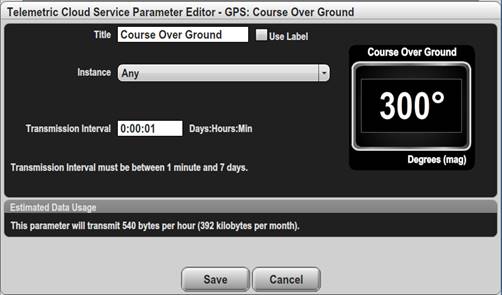
The heading at the top of the dialog shows the category name and parameter name for the parameter
15.3.1 Title
The title entered here will be transmitted to the Cloud to identify the data when downloaded. It may be overridden if the Use Label checkbox is checked, and valid label data is being received on the NMEA 2000 bus.
15.3.2 Use Label
When this checkbox is checked, the label from the device on the NMEA 2000 bus that is producing the data, will be transmitted to the Cloud. If no label data can be found on the NMEA 2000 bus, then the value entered in the Title field will be sent.
15.3.3 Instance
This identifies the Instance number of the data to be transmitted.
15.3.4 Source
If the parameter has a Source value (e.g. Tank Level requires the fluid type to be specified), then a list of possible sources will be presented.
15.3.5 Channel
When transmitting Switch/Circuit Breaker or Indicator values the channel number of the indicator will need to be selected.
15.3.6 Transmission Interval
The interval between successive transmissions of this Parameter. Enter the value as days : hours : minutes. The minimum interval allowed is one minute, and the maximum is 7 days. Any value entered outside this range will immediately be restricted to this range. Entering only one value, will be interpreted as minutes. (e.g. entering 100 will be taken as 1 hour : 40 minutes.
15.3.7 Also Transmit on Change
When transmitting Switch/Circuit Breaker or Indicator values, you have two options.
· Do not transmit every change of the value. (Checkbox unchecked) The value of the condition will be sampled every Transmission Interval, and the status at that moment will be transmitted. This will allow very accurate predictions of the bandwidth required by the parameter, but momentary changes in the condition will be missed. (e.g. if you are monitoring a door switch with a transmission interval of 1 minute and the door opens and then closes 10 seconds later, the door opening and closing will probably not appear in the data.)
· Transmit every change of the value. (Checkbox checked) The value of the condition will still be transmitted every transmission interval, and it will also be transmitted every time the condition changes. Now you can set the transmission interval to a longer period assured that you are not going to miss any momentary condition changes. The downside is every change in condition will now result in a transmission of data, and the estimated data usage cannot be predicted.
15.3.8 Estimated Data Usage
At the bottom of the dialog, the estimated data requirements on the upload link for this parameter will be displayed. If you have checked the Also Transmit on Change checkbox, you will also be shown the estimated number of bytes that will be transmitted on every change.
The estimated data usage shown here does not include any overhead added for data encryption and transmission overheads.
16 N2KView Mobile
N2KView® stations can run on the iPod Touch, iPhone, and iPad. It must be downloaded from the Apple App Store. Each iPhone station will require a connection to N2KServer.
N2KView® can run on Android phones / tablets running Android version 2.2 and later on the Arm v7-A processor. It must be downloaded from the Google Play store (formally Android Marketplace).
N2KView® can run on the Barnes and Noble Nook Color. It must be downloaded from the Barnes and Noble store.
N2KView® can run on the Kindle Fire. It must be downloaded from the Amazon App Store.
A license is not required to run N2KView Mobile.
This chapter is applicable to the iPod Touch, iPhone, iPad, Nook Color, Kindle Fire, and Android devices. For brevity, unless otherwise stated, statements relating to the iPhone will apply to all these devices.
16.1 Restrictions
N2KView Mobile does not support background processing, therefore all functionality that requires data collection while not visible are not available on the N2KView Mobile.
· Alerts – Alerts need to be monitored at all times. The iPhone will act as a remote display for Alerts generated by another N2KView® station or a DSM250, but will not monitor PGNs and generate the Alerts.
· Anchor Watch Component – This is dependent on having an Anchor Watch Alert, and so this component has been removed.
· Graphs – these require data collection at all times, and so have been removed.
· Gauges and Bar Graphs – The Max / Min Markers on these components are disabled.
· Counters and Timers – these require data collection at all times, and so have been removed.
16.2 Building the N2KView Mobile Screens
Just as in N2KView® for the PC, the iPhone can display a number of favorite screens. These screens are built on the PC, and saved to an IPG100 (see section 9.4.6.4.2) and then downloaded to the iPhone.
Before starting, save your normal ship’s Configuration so that it does not get confused with the iPhone’s Configuration (see section 9.4.6.4)
To fit on the iPhone, the screens should be constructed with a predefined size. Open the Screens Setup Dialog, and select a screen size of exactly 20 high, and a width that is a multiple of 16 (i.e. 16 for one page, 32 for 2 pages, 48 for 3 pages etc.). Different screens can be different widths. When displayed on the iPhone, each screen will be accessed through its own tab as shown below.
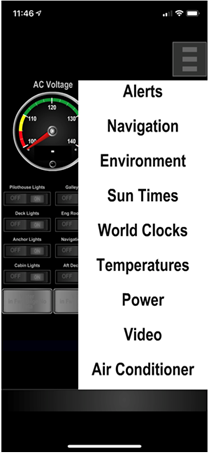
The pages within a screen are arranged from left to right. Swipe left and right with your fingers to move between the pages.
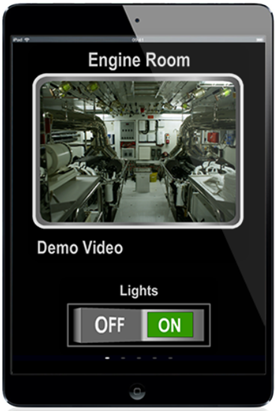
The dots at the bottom of the above example show that this screen has five pages (there are five dots), and that we are looking at the first page (the first dot is brighter than the rest).
Build all your screens as you would for a PC based version of N2KView, and save them to the IPG100. Note that you do not require an N2KView license to create screens or transfer them to an IPG100.
16.2.1 Other Configuration Data
On the Connections Page of N2KView, set up the following:
· Label – When you accept Alerts from the iPhone, the “What happened” field on the Alert Status will show this label as where the alert was accepted from.
On the Alerts Setup Page, set up the following
· Remote Alerts Play Computer Sound – While active Alerts are being received, the iPhone will beep is this is checked.
16.3 Send the Configuration to the IPG100
Change the Filename to something that will help you identify this configuration when you come to download the file to the iPhone. Use “iPhone.n2kview-config” or something similar.
Then press “Save” to open the Save Configuration Dialog (see section 9.4.6.4.2). In the Save Configuration To IPG100 section you will see the configuration name that you chose, and the “Send Configuration” button. This will be grayed out of there is no connection to the IPG100, in which case you will need to exit this dialog, establish the connection, and come back here.
Press “Send Configuration” to send the file to the server.
Reload you normal configuration to continue using N2KView on the PC.
16.4 Starting N2KView® on the iPhone
![]() After
downloading and installing N2KView®, and syncing your iPhone with
iTunes, press the N2KView® icon to start N2KView®.
After
downloading and installing N2KView®, and syncing your iPhone with
iTunes, press the N2KView® icon to start N2KView®.
While N2KView® is loading, you will see this splash screen. (Android does not show a splash screen)
When that is complete, you will be taken to the display screen for the Demo
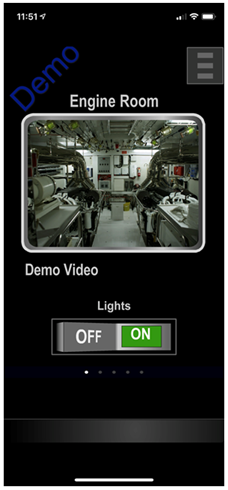
Let’s get familiar with the demo version before loading the configuration just placed on the server.
From version 3.6.0, N2KView mobile may be viewed in either portrait or landscape mode by rotating the mobile device. In portrait mode, one of the screens created on the PC is displayed at a time, and the pages to the left and right of it are reached by swiping one finger left and right on the screen. Swiping and down will move you the next or previous favorite screen.
In landscape mode, two of the pages are displayed side by side. If you respect the 20x16 grids when creating the pages, you will be assured that your components do not go off the edge of the screen.
When in Demo mode, Demo is displayed in the top left of the screen.
The first demo screen is the Engines screen, and in portrait mode you will display the leftmost page of the Engines Screen.
The Engines Screen has five pages as shown by the five dots at the bottom of the screen. Swipe the page to the left to see the next page.
To move to a different favorite screen, touch the ![]() symbol near the top
right of the screen. Similar to the PC version of N2KView, navigation button
slide into view. The actual layout of the navigation buttons depend on the
height and width of the mobile device.
symbol near the top
right of the screen. Similar to the PC version of N2KView, navigation button
slide into view. The actual layout of the navigation buttons depend on the
height and width of the mobile device.

Explore the other favorite screens by going back to the menu (press the Menu Button) and choosing a different button, and then scrolling left and right.
Notice the first and last tabs:
· Alerts: This tab will display the Alerts Page.
· Settings: This displays the Settings Page
· Exit: (Android only) Pressing this button will exit N2KView. Note that on the iPad, pressing the iPad button will exit N2KView.
16.5 Connecting to IPG100
First, make sure that the IPG100 is running, and you know the Password that was entered in the IPG100.
Touch the screen to display the tabs, and then press the Settings button. If the Settings button is not visible (it will always be at the bottom ) then scroll the list up.
This will display the Settings Page.
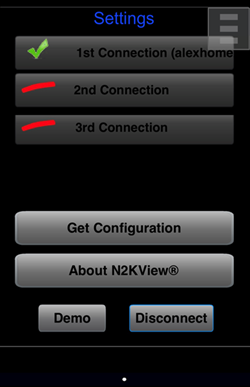
In this page you specify how you want to connect to the server on the IPG100 (directly or through the Maretron Cloud Services), which parameters to use, and which licenses to request.
Pressing any of the server buttons displays the Connection dialog. There are three options to connect to the IPG100 (First, Second, and Third). When the Connect button is pressed N2KView Mobile will attempt to make the first connection. If this fails, it tries the second and then the third. This enables the option to connect to three different vessels, or to set the first as the connection to use when on the boat (directly to the IPG100) and the second to use when off the boat (through the Maretron Real Time Cloud Service). These buttons are disabled when the mobile device is connected to an IPG100. Press the Disconnect button to make any changes.
16.5.1 LAN Connection Method
The LAN Connection should be used when connecting to an IPG100 on the same network as the mobile device. The IPG100 is identified by its serial number and even if its IP Address changes the mobile device will still find it.
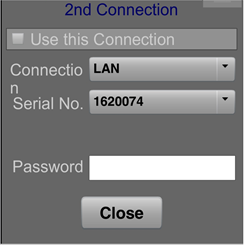
Use this Connection – this must be checked in order for the connection to be attempted.
Serial No. – this is a list of IPG100 detected on the network. Choose from the list.
Password – Enter the password that matches that entered on the IPG100
16.5.2 WAN Connection Method
The WAN Connection should be used when connecting to an IPG100 through a bridge to a different network as the mobile device, or when the router blocks the transmission of the messages identifying the IPG100. The IP Address and port of the IPG100 must be known and fixed.
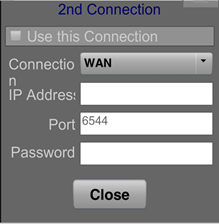
Use this Connection – this must be checked in order for the connection to be attempted.
IP Address – Enter the IP Address of the IPG100 or router if you are using port forwarding to reach the IPG100.
IP Address – Enter the Port Number of the IPG100 (always 6544) or the forwarded port on the router if you are using port forwarding to reach the IPG100.
Password – Enter the password that matches that entered on the IPG100
16.5.3 Cloud Connection Method
The Cloud Connection should be used when connecting to an IPG100 off the boat through the Maretron Real Time Cloud Service. An account on the Real Time Cloud Server must be created to use this service.
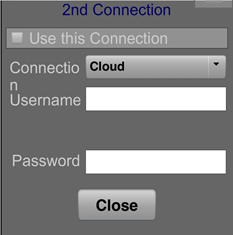
Use this Connection – this must be checked in order for the connection to be attempted.
Username – Enter the username of your Cloud Service account.
Password – Enter the password that matches that entered on the IPG100. Do not enter the password that you used to create your account on the rtcs.maretron.com website.
16.5.4 Connecting
Once you have selected how to connect to your N2KServer press the Connect Button. This will connect you with your server, and also switch the screens to the Active Screens stored in the iPhone.
N2KView for the iPhone is supplied with two sets of default favorite screens, one for the demos and one for the active connection. At this point you will be looking at the default favorite screen for the active connection, and it will be connected to your N2KServer, and trying to display your data.
Note also that the text on the button will change to Connecting (with moving green dots) Connected (with a green check symbol). If the connection is made, the Connect Button will change to Disconnect, and the top buttons will be disabled.
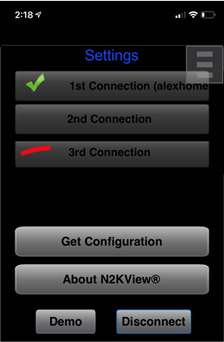
When the connection is made, the Settings Dialog continues to be displayed.
In the diagram above, the green check mark indicates that we are connected to the 1st Connection. The 2nd Connection was considered as an option (i.e. it was enabled), but the connection was not made, either because it was not required or the connection failed. If more than one option is enabled, the program will start at the top of the list and spend 10 seconds trying to connect to each enabled option before moving on to the next. At the bottom of the list, it wraps around back to the first enabled option. This does imply that it may take a bit longer to make the connection if the first option is not available. The red line on the 3rd Connection shows that this option was not enabled, and so was not considered as a candidate for connecting.
16.6 Download the Configuration File
Press the Get Configuration button. This button will have been inactive until a connection was made. N2KView will request the IPG100 to supply it with the list of files stored on the IPG100, and these will now be displayed below the button. You should be able to see the one file that we created earlier.
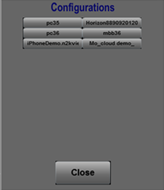
The layout of the buttons on the dialog will depend on the height and width of the mobile device.
Click on the button containing the filename, and your configuration file will be loaded onto the iPhone. While downloading, an hourglass will be overlaid on the screen, and a progress bar will display the progress of the download.
When the download is complete, the Settings Screen will be displayed.
Note that the iPhone stores only one active configuration file. The next time you start up this will be the configuration in the phone and it should connect automatically to your server.
Pressing the blue X will exit the Settings Screen.
16.7 About Screen
You may view the About Screen from the Settings Screen by pressing the About N2KView button
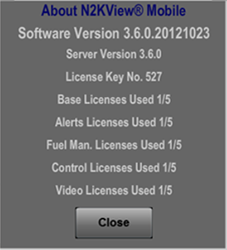
The details of this screen will vary depending on the connection made.
17 Troubleshooting
If you notice unexpected operation of the Maretron N2KView System, follow the troubleshooting procedures in this section to remedy simple problems.
|
Symptom |
Troubleshooting Procedure |
|
No data on the N2KView screen (all components display dashes for the data value and gauge indicators are at the end stop (peg)) |
Select the Commands & Settings Tab and then the Configuration sub-menu and open the NMEA 2000 Connection dialog. Press the Connect button, and look at the Connection Status: message for suggestions as to how to solve the problem.
Make sure that N2KServer is running on the computer whose Host address is specified in the Connections window. You can confirm this using N2KServer Service Manager.
Make sure that the NMEA 2000 gateway on the N2KServer computer is plugged into a powered-on NMEA 2000 network and to a USB port on the N2KServer computer, and is not being accessed by another program. You can confirm this by stopping the N2KServer service and making sure that the NMEA 2000 gateway you are using to interface to the NMEA 2000 network appears in the Gateway Serial Port list in the N2KServer Service Manager.
Make sure that the IP address of the computer running N2KServer is entered into the Server IP Address textbox on the Connection page of the N2KView station.
Make sure that the Server Port Number textbox of the Connection page of the N2KView station has the value 6544 in it.
Make sure that the value entered into the Enter the Encryption Password textbox on the Connection page of the N2KView station matches the value entered into the Server Password textbox of N2KServer Service manager.
Make sure that the IP address of the N2KServer computer is accessible from the computer running the N2KView station. You can verify this by opening a command prompt in Windows (go to the Start menu, then select Accessories, and then click on Command Prompt). In the command prompt window that enters, type “telnet <ip_address> 6544”. If this connection succeeds, you will see just a blank screen with a flashing cursor, and you have confirmed the IP address is visible. If the connection fails with a message such as “Count not open connection to the host, on port 6544: Connect Failed”, then the IP address is not visible and you should try the remedies that follow in this list or consult a networking expert.
Make sure that any firewall software on the N2KServer computer is configured to allow incoming connections on port 6544.
Make sure that any routers between the N2KServer and the internet are configured to forward incoming connections on port 6544 to the N2KServer computer. |
|
Only certain digital components display dashes for data or certain gauge indicators are at the end stop (peg) |
Make sure that you have the proper transducers on the NMEA 2000 network and that the transducers are properly programmed with the right source type and instance number (if applicable) Check the Windows Event Log, Applications Log section for any warning or error messages that N2KServer Windows Service may have written there. |
|
N2KServer reports that the version of firmware in the USB100 is not high enough to run N2KServer. |
Contact Maretron to receive a firmware upgrade for your USB100. |
|
N2KView works correctly for a period of time, but sometimes stops displaying data (all digital components display dashes for data and gauge component indicators are at the end stop (or peg)). |
Select the Connections tab and open the Connections window. Press the Connect button, and look at the Connection Status: message for suggestions as to how to solve the problem. Check that the N2KServer Windows Service is still running by using the N2KServer Service Manager. Check that the N2KServer computer is powered on. Check that the NMEA 2000 network connected to the N2KServer computer is powered on. Check to make sure you are
running the most recent version of the Maretron USB100 gateway device
driver. Open Windows Device Manager, select the “Ports (COM & LPT) menu,
double click on the “Maretron NMEA 2000 Gateway”, select the “Driver” tab,
and finally click on the “Update Driver” button and follow the instructions
in the Update Driver Wizard that appears. |
|
N2KServer Service Manager reports an error starting or stopping the Windows Service when you try to stop or start the N2KServer Windows Service |
Ensure that you are running the N2KServer Service Manager from a Windows account that has administrative rights to the N2KServer computer. |
|
The N2KServer computer does not have an N2KServer hardware key, and you keep seeing textboxes warning you that N2KServer cannot find the red N2KServer hardware license key. |
Ensure that the requested red N2KServer hardware license key is installed. If you do not have the hardware license key, open N2KServer Service Manager and uncheck the “Start N2KServer When Windows Starts” checkbox. |
|
When you press the switch actuator component, the switch does not change state.
|
Switch Actuator components are only fully operational when the Control Module has been licensed. If you wish to use these features, please ensure that you have purchased a license for the Control Module and that you have requested a license for the Control Module in the Connection Dialog. |
|
Components display “Not Licensed” instead of a numeric value. |
Fuel Management components are only fully operational when the Fuel Management Module has been licensed. If you wish to use these features, please ensure that you have purchased a license for the Fuel management Module and that you have requested a license for the Fuel Management Module in the Connection Dialog. |
If these steps do not solve your problem, please contact Maretron Technical Support (refer to Section 17 for contact information).
18 Technical Support
If you require technical support for Maretron products, you can reach us in any of the following ways:
Phone: +1-602-861-1707
Telephone: +1-866-550-9100
Fax: +1-602-861-1777
Sales email: [email protected]
Support email: marine.[email protected]
World Wide Web: https://www.maretron.com
Mail: Maretron,
Carling Technologies Inc.
Attn: Technical
Support
120 Intracoastal Pointe
Drive
Jupiter FL, 33477
USA
19 Maretron Software License Agreement
WARNING! CAREFULLY READ THIS ENTIRE SOFTWARE LICENSE AGREEMENT ("AGREEMENT") BEFORE USING THE ENCLOSED SOFTWARE PROGRAM. THIS AGREEMENT IS LEGALLY BINDING UPON YOU (EITHER AN INDIVIDUAL OR ENTITY) AND MARETRON, LLP. BY OPENING THE SEALED SOFTWARE PACKAGE AND/OR BY USING THIS SOFTWARE, YOU AGREE TO BE BOUND BY THE TERMS AND CONDITIONS OF THIS AGREEMENT, INCLUDING, BUT NOT LIMITED TO, THE SOFTWARE LICENSE RESTRICTIONS ON USE, LIMITED WARRANTY, AND DISCLAIMER. IF YOU DO NOT AGREE WITH THESE TERMS AND CONDITIONS, PROMPTLY RETURN THE SOFTWARE AND ACCOMPANYING MATERIALS (INCLUDING THE DISC PACKAGE, PRINTED MATERIALS AND BINDERS OR OTHER CONTAINERS) TO THE PLACEOF PURCHASE FOR A FULL REFUND.
ALL MARETRON PROGRAM SOFTWARE COMES WITH A 30-DAY MONEY BACK GUARANTEE IF PURCHASED DIRECTLY FROM MARETRON. AN RETURN MERCHANDISE AUTHORIZATION (RMA) NUMBER MUST ACCOMPANY ALL RETURNED PRODUCTS. PLEASE CONTACT MARETRON AT +1-602-861-1707 AND ASK FOR CUSTOMER SERVICE IN ORDER TO OBTAIN ONE IF THE NEED ARISES. MARETRON SOFTWARE YOU PURCHASED FROM A DEALER MUST BE RETURNED TO THAT DEALER FOR A REFUND IF THEY HAVE A RETURN POLICY. HARDWARE LICENSE KEY (DONGLE) EXCHANGES REQUIRE THE DONGLE BE RETURNED TO MARETRON FOR REPLACEMENT BEFORE A NEW DONGLE CAN BE ISSUED. MARETRON RESERVES THE RIGHT TO REFUSE REFUNDS ON ANY OR ALL MARETRON PRODUCTS.
This Agreement is proof of license to exercise the rights granted herein. Please treat it as valuable property.
1. DESCRIPTION OF SOFTWARE. The SOFTWARE may include accompanying materials, including, but not limited to, certain portions of the SOFTWARE may be owned by Maretron and other portions of the SOFTWARE may be owned by one or more third parties. Your use of this SOFTWARE is subject to all of the terms and conditions of this License Agreement.
2. GRANT OF LICENSE. Except as otherwise provided for herein, Maretron hereby grants to you a non-transferable, personal, non-exclusive license to use the SOFTWARE during the License Term (as defined below) for your benefit on a maximum of one (1) of your own personal computers. The SOFTWARE is "in use" on a computer when it is loaded into temporary memory (i.e. RAM) or installed into permanent memory (e.g. hard disk, CD-ROM, or other storage device) of that computer. Maretron expressly reserves any and all rights that it may have in or to the SOFTWARE which are not expressly licensed by Maretron to you hereunder.
3. OTHER RESTRICTIONS. Except for the initial loading of the SOFTWARE described in Section 2 above, you shall not (a) copy, duplicate, reproduce or publish the SOFTWARE; (b) electronically transfer the SOFTWARE to multiple computers over a network; (c) distribute copies of the SOFTWARE to others by any means whatsoever; (d) modify, adapt, translate, reverse engineer, disassemble or decompile the SOFTWARE in any way or create derivative works (i.e. works which include or are derived from any portion of the SOFTWARE) based on the SOFTWARE; (e) modify, adapt, translate, or create derivative works based on the printed, electronic or written materials; (f) assign, rent, exchange, lend, lease or sublease the SOFTWARE; or (g) sell or transfer the SOFTWARE. In no event shall you make any use of the SOFTWARE for commercial purposes except as expressly permitted herein, it being understood that, except as so expressly permitted, your sole rights with respect to the SOFTWARE shall be to use the SOFTWARE for your own benefit and not for the benefit of any third party. Notwithstanding the foregoing, you may transfer you rights under this Agreement on a permanent basis provided that you transfer this Agreement and the SOFTWARE and that you do not retain any copies of this Agreement or SOFTWARE and that the transferee agrees to all of the terms and conditions of this Agreement.
4. UPGRADES. If the SOFTWARE is an upgrade from a Maretron product, you now may use that upgraded product only in accordance with this Agreement.
5. LICENSE TERM. The term of the license granted to you hereunder (the "License Term") will commence upon your opening of the sealed software package and/or by using this SOFTWARE and will continue indefinitely unless and until the Agreement is terminated. The Agreement shall be terminated as follows: (a) you may terminate the Agreement at any time, with or without cause, effective upon your delivery to Maretron of written notice of termination; or (b) the Agreement shall terminate immediately and without notice if you fail to comply with any term or condition of this Agreement.
6. EFFECT OF TERMINATION. All of the provisions of this Agreement which are not expressly limited to the period of the License Term, including without limitation the provisions regarding disclaimers of warranties, limitations of liability, remedies and proprietary rights, shall survive the termination of the License Term. Promptly following the termination of the License Term, you shall either destroy or return to Maretron any and all copies of the SOFTWARE.
7. GOVERNMENT RESTRICTED RIGHTS. THE FOLLOWING ADDITIONAL RESTRICTIONS AND DISCLAIMERS MAY APPLY TO YOU:
(a) U.S. GOVERNMENT RESTRICTED RIGHTS. This SOFTWARE and accompanying documentation is provided with restricted rights. Use, duplication or disclosure by the U.S. Government is subject to the restrictions set forth in subparagraph (c)(1)(ii) of the Rights in Technical Data and Computer Software clause at DFARS 252.227-7013 or subparagraphs (c)(1) and (2) of the Commercial Computer Software - Restricted Rights at 48 CFR 52.227 - 19, as applicable. Manufacturer is Maretron, LLP, 9014 N. 23rd Ave. Suite 10, Phoenix, AZ 85021.
8. LIMITED WARRANTY AND DISCLAIMER. Maretron warrants that the magnetic and/or optical media on which this SOFTWARE is recorded is free from defects in materials and workmanship under normal use and operation. Maretron does not warrant that this SOFTWARE is error free, that it will perform without interruption or that it is compatible with products manufactured by any person or entity other than Maretron. This SOFTWARE utilizes NMEA 2000 data for information which may contain errors. Maretron does not warrant the accuracy of such information and you are advised that errors in such information may cause the SOFTWARE to give inaccurate readings.
The above warranty is exclusive and is in lieu of all others, express or implied. It does not cover any SOFTWARE which has been subjected to damage or abuse, which has been altered or changed in any way, or which is operated in a manner inconsistent with the instructions for use provided by Maretron. Maretron is not responsible for problems caused by the interaction of the SOFTWARE with products manufactured by others or for problems arising from errors in the data or information provided by third parties, including the other NMEA 2000 instruments.
Except for the limited warranty regarding the magnetic and/or optical media, this SOFTWARE is provided "AS IS" without warranty of any kind, either express or implied, including but not limited to the implied warranties of merchantability and fitness for a particular purpose, and any which may arise from the course of performance, course of dealing, or usage of trade.
The limited warranty provided above is made to you if you (a) are registered with Maretron as a user of this SOFTWARE, (b) have fully paid the required license fee, (c) have fully complied with the terms of the license, and (d) are the original licensed end-user. No warranty is made to any other person or entity.
The limited warranty provided above will be effective for a period of sixty (60) following your receipt of this SOFTWARE.
EXCEPT AS EXPRESSLY STATED ABOVE, MARETRON MAKES NO WARRANTY WHATSOEVER, WHETHER EXPRESS OR IMPLIED, WITH RESPECT TO THE SOFTWARE OR ITS CAPABILITY, VALIDITY, ACCURACY OR RELIABILITY, AND DISCLAIMS ANY LIABILITY FOR THE SOFTWARE OR THE DESIGN, ACCURACY, SAFETY OR CONFORMANCE WITH ANY GOVERNMENT STANDARDS, INCLUDING, BUT NOT LIMITED TO, ANY EXPRESS OR IMPLIED WARRANTY OF MERCHANTABILITY OR FITNESS FOR A PARTICULAR PURPOSE.
Some states do not allow the exclusion of implied warranties, so the above exclusion may not apply to you. This warranty gives you specific rights, and you may also have other rights, which vary state to state.
9. INDEMNIFICATION. You agree to indemnify, defend and hold harmless Maretron and its suppliers from and against any and all claims, costs, liabilities, damages and expense (including, but not limited to reasonable attorneys fees and legal costs), including claims by third parties, which Maretron may suffer, sustain or incur as result of (a) your breach of any of the terms and conditions of this Agreement and/or (b) your use of the SOFTWARE, except to the extent that Maretron is liable under any express warranty set forth herein.
10. REMEDIES. As noted above, the limited warranty provided above will be effective for a period of sixty (60) days following your receipt of this SOFTWARE. During the warranty period, Maretron will, at its sole option, (a) repair or replace, without charge, on an exchange basis, any magnetic diskette or optical disk which proves defective in materials or workmanship or (b) refund the fees paid for licensing the SOFTWARE. This is Maretron’s entire liability and your sole and exclusive remedy. This remedy shall not apply if the storage device on which the SOFTWARE is stored has been damaged by negligence, accident, improper or unreasonable use, or by any other cause, unrelated to defective material or workmanship.
If you have a warranty claim, you must contact the Maretron customer services department for a return authorization during the warranty period. If the customer service representative is unable to correct your problem, you will be provided with a return authorization number and an address for returning the defective item for warranty service or replacement.
You must either return the defective item post-paid, postmarked within the time period stated above. You must either insure the defective item being returned or assume the risk of loss or damage in transit. Any claim under the above warranty must include a copy of your receipt or invoice or other proof of the date of delivery. No warranty claims will be honored which are made after the expiration of the warranty period.
11. LIMITATION OF LIABILITY. MARETRON AND ITS SUPPLIERS SHALL NOT IN ANY CASE BE LIABLE TO YOU OR TO ANY THIRD PARTY FOR DIRECT, SPECIAL, INCIDENTAL, INDIRECT, CONSEQUENTIAL, PUNITIVE OR EXEMPLARY OR OTHER DAMAGES OF ANY NATURE WHATSOEVER (INCLUDING BUT NOT LIMITED TO LOSS OF USE, REVENUE, PROFIT, DATA, PROPERTY DAMAGE OR INJURY) WHETHER SUCH LIABILITY IS ASSERTED ON THE BASIS OF CONTRACT, WARRANTY, CONTRIBUTION, STRICT LIABILITY, TORT OR OTHER THEORY ARISING OUT OF THIS AGREEMENT, OR THE USE OR THE INABILITY TO USE THE SOFTWARE OR ANY OTHER LEGAL THEORIES, EVEN IF MARETRON OR ITS AGENT OR SUPPLIER HAS BEEN ADVISED OF THE POSSIBILITY OF SUCH DAMAGES. IN NO CASE SHALL MARETRON'S LIABILITY EXCEED THE LICENSE FEES PAID BY YOU FOR THE SOFTWARE.
Some states do not allow the exclusion or limitation of direct, indirect, incidental or consequential damages, so the above exclusions or limitations may not apply to you.
If a court of competent jurisdiction determines that relevant laws in force may imply warranties and liabilities which cannot be excluded or limited or which can only partly be excluded or limited, then the limit on Maretron's liability set forth in this Section 12 shall apply to the fullest extent permitted by law. If Maretron cannot exclude or limit a warranty or liability implied by law, this Agreement shall be read and construed subject to such provisions of law.
12. SOFTWARE OWNERSHIP. The SOFTWARE, and all copies and derivative works thereof, are and shall remain the sole and exclusive property of Maretron or its suppliers and are protected by United States copyrights laws and international treaty provisions. Therefore, you must treat the SOFTWARE like any other copyrighted material (e.g. a book or musical recording). All applicable rights to copyrights, patents, trade secrets, trademarks and other intellectual property in and to the SOFTWARE are and shall remain in Maretron and its suppliers. To the extent that you may acquire any right or interest in or to the SOFTWARE, other than the rights and license expressly granted to you herein, you agree that you shall be deemed to have assigned such rights to Maretron. This license shall not be considered a "sale" of the SOFTWARE.
13. SEVERABILITY. If any provision or any part of a provision of this Agreement shall be held invalid or unenforceable, then the remaining portions of that provision and the remainder of the Agreement shall be construed as if not containing the particular invalid or unenforceable provision or portion thereof, and the rights and obligations of each party shall be construed and enforced accordingly.
14. ASSIGNMENT. This Agreement and the license granted herein are personal to you and, except as otherwise provided for herein, they may not be transferred or assigned. This Agreement and all terms and conditions contained herein shall be inure to the benefit of and be binding upon Maretron's successors and assigns.
15. WAIVER. Failure to insist upon strict compliance with any of the terms or conditions of this Agreement shall not be deemed a waiver of such term or condition.
16. ENTIRE AGREEMENT. This Agreement contains the entire understanding of the parties hereto relating to the subject matter hereof and superseded all prior or contemporaneous representations or agreements of the parties whether written or oral. No waiver or modification of any of the terms hereof shall be valid unless in writing and signed by the parties. No waiver of any breach shall be deemed a waiver of any subsequent breach. If any provision of this Agreement is held to be invalid or unenforceable, the remaining provisions shall not be affected.
20 Example of Setting up the AXIS Quad Video Server 241Q
Please read the installation manual that came with your video server. This chapter should not be considered a substitute for reading the Axis documentation.
20.1 Install the AXIS Camera Manager
a. Insert the disk supplied with the video server into the computer and navigate to the Axis Camera Management Setup program. If the autorun feature of the CD does not work, the setup program can be found at <cd drive>:\AutoPlay\Software\ACMSetup.exe.
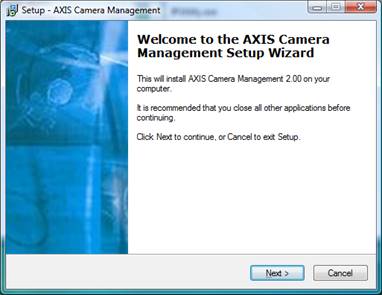
b. Continue to press “next” until the installation is complete, and then press “Finish”.
c. Connect the camera to the server, and the server to the network, and connect their respective power supplies.
20.2 Configure the camera
a. Start the AXIS Camera Management Tool, by selecting it in the list of All Programs under the Windows Start menu.
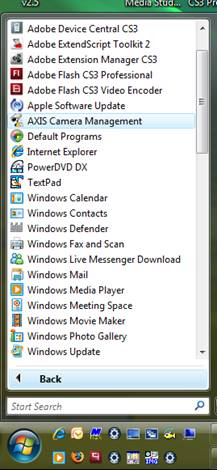
b. The resulting screen will show the cameras on the network that have been detected. In this case, two video servers were found in the network. Note the address allocated to the server, you will need to enter it in the Camera Editor of N2KView. This can either be the IP address (10.0.0.94) or the camera’s name if the address is provided dynamically from a DNS Server (axis-00408c93ad7a.phx.aiec.com).
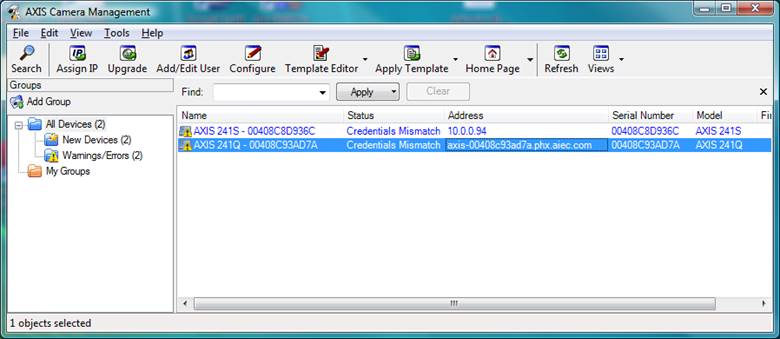
c. Double click on the name “Axis 241Q” to log on to the video server. You will be prompted for a username and password. The default username is “root” and the default password “pass”.
d. The camera will provide the following web page to your default browser.
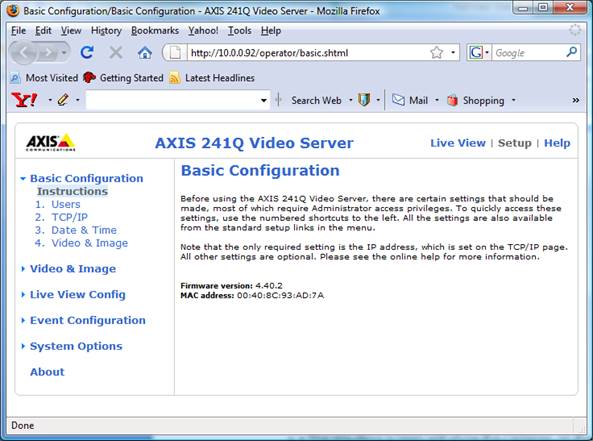
e. Set the following parameters in the Users Page. Note that after setting the parameters, you will need to press the Save button at the bottom of the page.
i. Enable anonymous login – from version 6.0.12 N2KView will work with cameras with usernames and passwords. If this is not checked, you will need to supply a username and password in the Camera Edit dialog.
ii. Enable anonymous PTZ control login – from version 6.0.12 N2KView will work with cameras with usernames and passwords. If this is not checked, you will need to supply a username and password in the Camera Edit dialog.
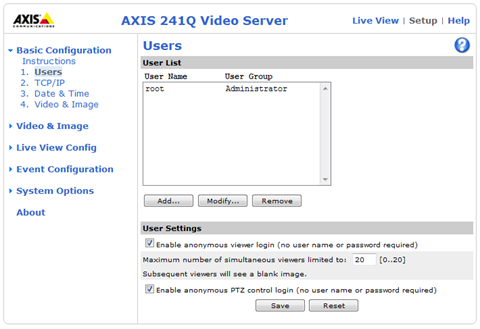
f. Set the following parameters in the TCP/IP Page. In this example, we are hard-coding the IP Address, which is suitable for a simple network. If you have a router (e.g. a wireless router) connected to your network, then choose the option Obtain IP address via DHCP. Note that after setting the parameters, you will need to press the Save button at the bottom of the page.
iii. Set the IP Address to x.y.z.a where the IP Address (x.y.z.a) is compatible with the addressing mechanism of your network. If none of this makes any sense to you, contact the person who installed / maintains your network.
iv. Set the Subnet Mask to 255.255.255.0
v. Set the Default Router to x.y.z.1
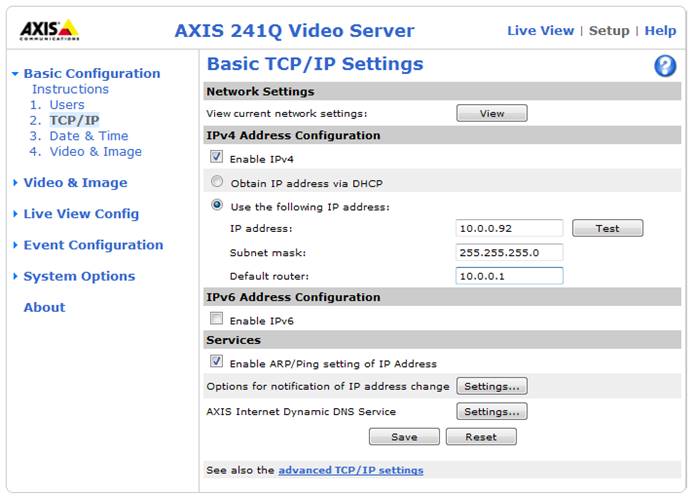
g. Pressing Save will change the address on the server, and will require you to log on again at the new address. You get the following warnings…
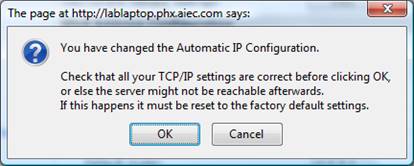

h. After pressing OK, enter the IP address that you chose in the address field at the top of the page

The following screen will ask you to select your own password for root (it was “pass”), but now you will select your own. If you forget this password, you will still be able to see the video, but will not be able to change any of the camera configuration parameters. The server can be reset to factory defaults by pressing the recessed button on the front panel, but then you will need to redo this whole procedure.
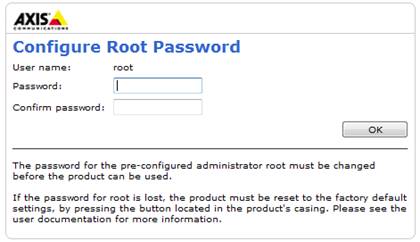
Pressing OK will display the video in the default quad steam format. Change the source to match the camera that you are installing.
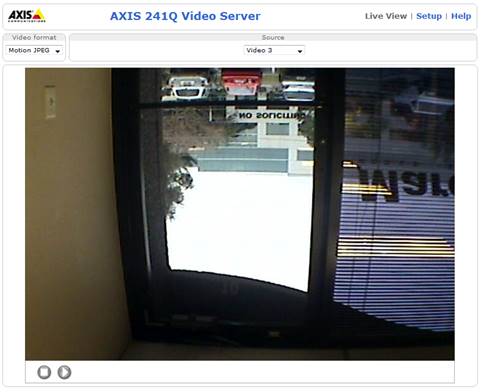
i. If required rotate the picture in the image page by clicking on Setup at the top of the screen, then Video and Image on the left, and navigate down to the Image menu under the camera number of your choice. Remember to press Save after selection the correct rotation.
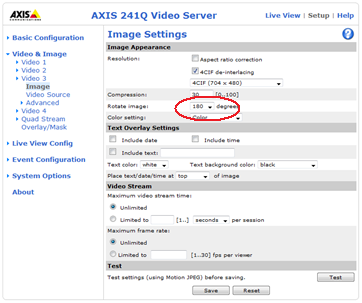
j. Test that you can see the video by selecting Live View at the top of the page..
If you are requested to install the Axis Media Control Plugin, do so. Set the Source to match the input to which you have connected your camera on the server. You may need to change the Video Format to Motion JPEG to see a picture.
